


How do you graph the line $ y = \left| { - x + 3} \right| - 4 $ ?
Answer
544.5k+ views
Hint: A graph of a function f is the set of ordered pairs; the equation of graph is generally represented as $ y = f\left( x \right) $ , where x and f(x) are real numbers. We substitute the value of x and we determine the value of y and then we mark the points in the graph and we join the points.
Complete step by step solution:
Here in this question, we have to plot the graph for the given function. A graph of a function is set of ordered pairs and it is represented as $ y = f\left( x \right) $ , where x and f(x) are real numbers. These pairs are in the form of cartesian form and the graph is the two-dimensional graph.
First, we have to find the value of y by using the graph equation $ y = \left| { - x + 3} \right| - 4 $ . Let we substitute the value of x as $ 0 $ , $ 1 $ , $ 2 $ , and $ 3 $ .
Now we consider the value of x as $ 0 $ , the value of y is
$ \Rightarrow y = \left| { - 0 + 3} \right| - 4 $
$ \Rightarrow y = \left| 3 \right| - 4 $
$ \Rightarrow y = 3 - 4 $
$ \Rightarrow y = - 1 $
Now we consider the value of x as $ 1 $ , the value of y is
$ \Rightarrow y = \left| { - 1 + 3} \right| - 4 $
$ \Rightarrow y = \left| 2 \right| - 4 $
$ \Rightarrow y = 2 - 4 $
$ \Rightarrow y = - 2 $
Now we consider the value of x as $ 2 $ , the value of y is
$ \Rightarrow y = \left| { - 2 + 3} \right| - 4 $
$ \Rightarrow y = \left| 1 \right| - 4 $
$ \Rightarrow y = - 3 $
Now we consider the value of x as $ 3 $ , the value of y is
$ \Rightarrow y = \left| { - 3 + 3} \right| - 4 $
$ \Rightarrow y = - 4 $
Now we draw a table for these values we have
The graph plotted for these point is represented below:
Note: The graph is of two dimensional. By the equation of a graph, we can plot the graph by assuming the value of x. We can’t assume the value of y as the value of y depends on the value of x. When a modulus function is applied in front of a function, the function acquires positive value for any input value.
Complete step by step solution:
Here in this question, we have to plot the graph for the given function. A graph of a function is set of ordered pairs and it is represented as $ y = f\left( x \right) $ , where x and f(x) are real numbers. These pairs are in the form of cartesian form and the graph is the two-dimensional graph.
First, we have to find the value of y by using the graph equation $ y = \left| { - x + 3} \right| - 4 $ . Let we substitute the value of x as $ 0 $ , $ 1 $ , $ 2 $ , and $ 3 $ .
Now we consider the value of x as $ 0 $ , the value of y is
$ \Rightarrow y = \left| { - 0 + 3} \right| - 4 $
$ \Rightarrow y = \left| 3 \right| - 4 $
$ \Rightarrow y = 3 - 4 $
$ \Rightarrow y = - 1 $
Now we consider the value of x as $ 1 $ , the value of y is
$ \Rightarrow y = \left| { - 1 + 3} \right| - 4 $
$ \Rightarrow y = \left| 2 \right| - 4 $
$ \Rightarrow y = 2 - 4 $
$ \Rightarrow y = - 2 $
Now we consider the value of x as $ 2 $ , the value of y is
$ \Rightarrow y = \left| { - 2 + 3} \right| - 4 $
$ \Rightarrow y = \left| 1 \right| - 4 $
$ \Rightarrow y = - 3 $
Now we consider the value of x as $ 3 $ , the value of y is
$ \Rightarrow y = \left| { - 3 + 3} \right| - 4 $
$ \Rightarrow y = - 4 $
Now we draw a table for these values we have
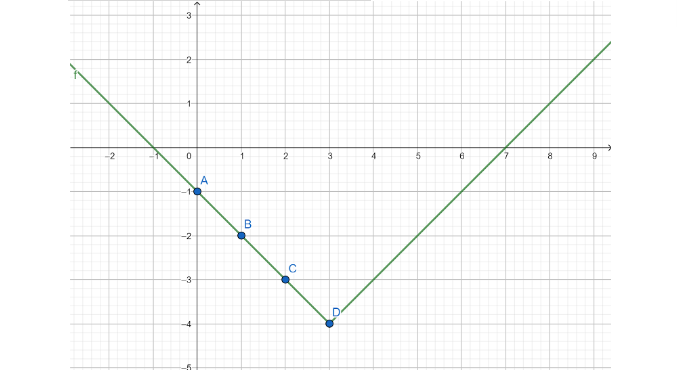
| x | $ 0 $ | $ 1 $ | $ 2 $ | $ 3 $ |
| y | $ - 1 $ | $ - 2 $ | $ - 3 $ | $ - 4 $ |
The graph plotted for these point is represented below:
Note: The graph is of two dimensional. By the equation of a graph, we can plot the graph by assuming the value of x. We can’t assume the value of y as the value of y depends on the value of x. When a modulus function is applied in front of a function, the function acquires positive value for any input value.
Recently Updated Pages
Master Class 10 Computer Science: Engaging Questions & Answers for Success
Master Class 10 General Knowledge: Engaging Questions & Answers for Success
Master Class 10 English: Engaging Questions & Answers for Success
Master Class 10 Social Science: Engaging Questions & Answers for Success
Master Class 10 Maths: Engaging Questions & Answers for Success
Master Class 10 Science: Engaging Questions & Answers for Success
Trending doubts
The draft of the Preamble of the Indian Constitution class 10 social science CBSE
Who gave "Inqilab Zindabad" slogan?
Who was Subhash Chandra Bose Why was he called Net class 10 english CBSE
Differentiate between Food chain and Food web class 10 biology CBSE
State and prove the Pythagoras theorem-class-10-maths-CBSE
My birthday is June 27 a On b Into c Between d In class 10 english CBSE