


How do you graph the line $y = - 2$ by plotting points?
Answer
507.3k+ views
Hint: In the given question, we have to draw the graph for the line whose equation is provided to us in the question itself as $y = - 2$. So, we first find some points lying on the straight line and make a table of coordinates of the points. Then, we plot these points on the graph and the line passing through them.
Complete step by step answer:
We have to plot the graph for the given equation $y = - 2$.
We first represent the equation of a line in general form as $ax + by + c = 0$
So, we get, $0x + 1y + 2 = 0$
First, we have to find the value of y by using the graph equation $0x + 1y + 2 = 0$. Let us substitute the value of x as $0$, $2$, and $4$.
Now we consider the value of x as $0$, the value of y is
$ \Rightarrow 0\left( 0 \right) + 1y + 2 = 0$
$ \Rightarrow y = - 2$
Now we consider the value of x as $2$, the value of y is
$ \Rightarrow 0\left( 2 \right) + 1y + 2 = 0$
$ \Rightarrow y + 2 = 0$
$ \Rightarrow y = - 2$
Now we consider the value of x as $4$, the value of y is
$ \Rightarrow 0\left( 4 \right) + 1y + 2 = 0$
$ \Rightarrow y + 2 = 0$
$ \Rightarrow y = - 2$
Now we will add the data to the table for these values,
The graph plotted for these point is represented below:
Note: The graph has two axes: x-axis and y-axis. x-axis is the horizontal axis and the y-axis is the vertical axis. The slope of the line is denoted by ‘m’ and tells the rate of change of y with respect to x. y is the dependent variable and x is the independent variable. The graph that we have plotted has a scale of one unit square representing one unit. The slope of the line plotted is zero as it makes an angle of zero degrees with the positive direction of the x axis.
Complete step by step answer:
We have to plot the graph for the given equation $y = - 2$.
We first represent the equation of a line in general form as $ax + by + c = 0$
So, we get, $0x + 1y + 2 = 0$
First, we have to find the value of y by using the graph equation $0x + 1y + 2 = 0$. Let us substitute the value of x as $0$, $2$, and $4$.
Now we consider the value of x as $0$, the value of y is
$ \Rightarrow 0\left( 0 \right) + 1y + 2 = 0$
$ \Rightarrow y = - 2$
Now we consider the value of x as $2$, the value of y is
$ \Rightarrow 0\left( 2 \right) + 1y + 2 = 0$
$ \Rightarrow y + 2 = 0$
$ \Rightarrow y = - 2$
Now we consider the value of x as $4$, the value of y is
$ \Rightarrow 0\left( 4 \right) + 1y + 2 = 0$
$ \Rightarrow y + 2 = 0$
$ \Rightarrow y = - 2$
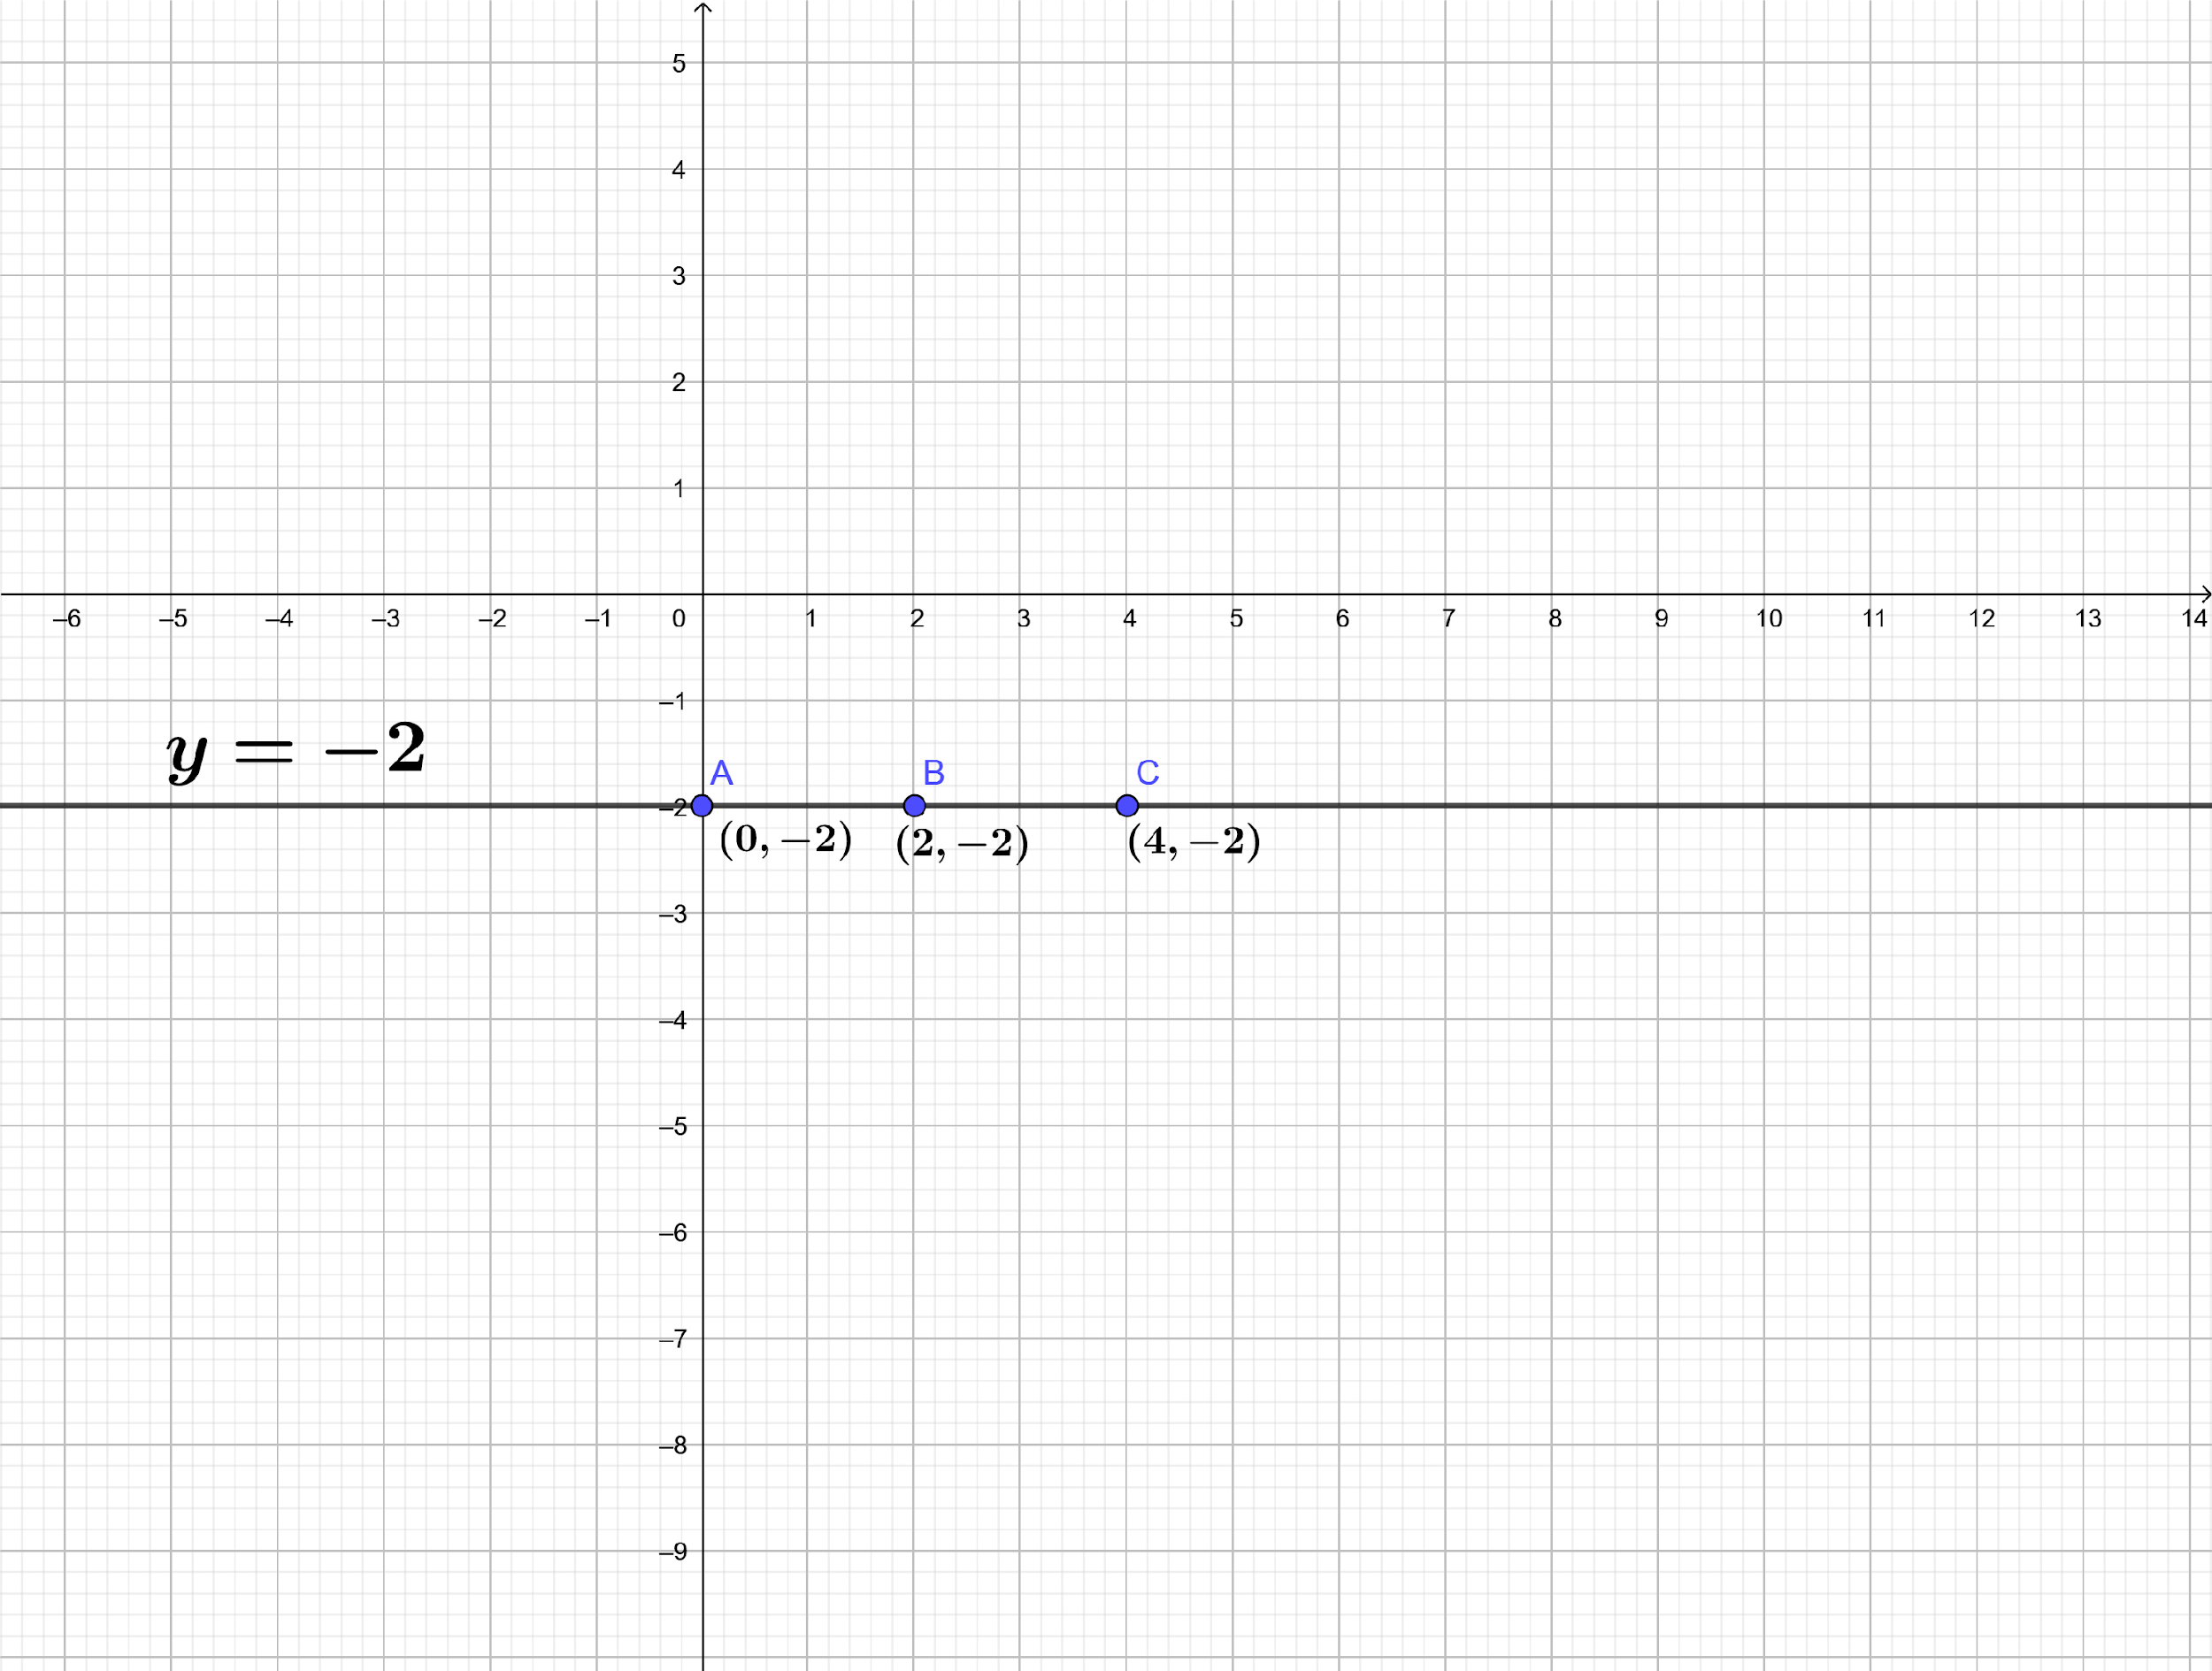
Now we will add the data to the table for these values,
| x | $0$ | $2$ | $4$ |
| y | $ - 2$ | $ - 2$ | $ - 2$ |
The graph plotted for these point is represented below:
Note: The graph has two axes: x-axis and y-axis. x-axis is the horizontal axis and the y-axis is the vertical axis. The slope of the line is denoted by ‘m’ and tells the rate of change of y with respect to x. y is the dependent variable and x is the independent variable. The graph that we have plotted has a scale of one unit square representing one unit. The slope of the line plotted is zero as it makes an angle of zero degrees with the positive direction of the x axis.
Recently Updated Pages
Master Class 9 Social Science: Engaging Questions & Answers for Success
Master Class 9 Science: Engaging Questions & Answers for Success
Master Class 9 Maths: Engaging Questions & Answers for Success
Master Class 9 General Knowledge: Engaging Questions & Answers for Success
Class 9 Question and Answer - Your Ultimate Solutions Guide
Master Class 8 Social Science: Engaging Questions & Answers for Success
Trending doubts
Find the sum of series 1 + 2 + 3 + 4 + 5 + + 100 class 9 maths CBSE
What is the Full Form of ISI and RAW
Fill the blanks with the suitable prepositions 1 The class 9 english CBSE
Difference Between Plant Cell and Animal Cell
Who is eligible for RTE class 9 social science CBSE
What is pollution? How many types of pollution? Define it