


How do you graph the inequality \[y > - 1\] and \[x \geqslant 4\] ?
Answer
547.8k+ views
Hint: First we need to draw the graph of the equation \[y = - 1\] and \[x = 4\]. We use intercept form to draw the graph. That is we find the coordinate of the given equation lying on the line of x- axis, we can find this by substituting the value of ‘y’ is equal to zero (x-intercept). Similarly we can find the coordinate of the equation lying on the line of y- axis, we can find this by substituting the value of ‘x’ equal to zero (y-intercept). After drawing the graph we can check in which region the inequality satisfies. Here if we draw \[y > - 1\] and \[x \geqslant 4\] we will have a parallel line to the x-axis and y-axis respectively.
Complete step by step answer:
Given, \[y > - 1\] and \[x \geqslant 4\]. Now consider \[y = - 1\] and \[x = 4\].
For \[y = - 1\]
Here we don’t have an ‘x’ variable in the given equation.
So ‘y’ will always equal to \[ - 1\], no matter what value we put in for ‘x’, the ‘y’ is always going to be \[ - 1\]. That is,
Similarly for \[x = 4\]. Here we don’t have a ‘y’ variable in the given equation. So ‘x’ will always equal to \[4\], no matter what value we put in for ‘y’, the ‘x’ is always going to be \[4\]. That is,
Let’s plot a graph for these coordinates,we take scale x-axis= 1 unit = 1 units and y-axis= 1 unit = 1 units.
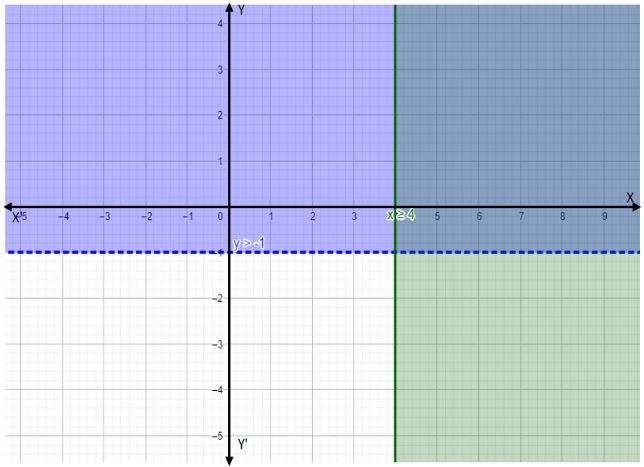
For \[y > - 1\], we can see in the graph that we have a straight horizontal line that crosses the y axis at \[ - 1\]. The solution is all the coordinate points above the line \[y = - 1\]. For \[x \geqslant 4\], we can see in the graph that we have a straight vertical line that crosses the x axis at \[4\]. The solution is all the coordinate points right to the line \[x = 4\]. In the above graph the shaded region is the solution of the given inequality.
Note: We don’t take points lying on the line \[y = - 1\] for the inequality \[y > - 1\]. We take the point that lies on the line \[x = 4\] for the inequality \[x \geqslant 4\]. A graph shows the relation between two variable quantities, it contains two axes perpendicular to each other namely the x-axis and the y-axis. Each variable is measured along one of the axes. In the question, we are given one linear equation containing two variables namely x and y, x is measured along the x-axis and y is measured along the y-axis while tracing the given equations.
Complete step by step answer:
Given, \[y > - 1\] and \[x \geqslant 4\]. Now consider \[y = - 1\] and \[x = 4\].
For \[y = - 1\]
Here we don’t have an ‘x’ variable in the given equation.
So ‘y’ will always equal to \[ - 1\], no matter what value we put in for ‘x’, the ‘y’ is always going to be \[ - 1\]. That is,
| \[x\] | \[1\] | \[ - 1\] | \[2\] | \[ - 2\] | \[3\] | \[ - 3\] | \[4\] | \[ - 4\] |
| \[y\] | \[ - 1\] | \[ - 1\] | \[ - 1\] | \[ - 1\] | \[ - 1\] | \[ - 1\] | \[ - 1\] | \[ - 1\] |
Similarly for \[x = 4\]. Here we don’t have a ‘y’ variable in the given equation. So ‘x’ will always equal to \[4\], no matter what value we put in for ‘y’, the ‘x’ is always going to be \[4\]. That is,
| \[x\] | \[4\] | \[4\] | \[4\] | \[4\] | \[4\] | \[4\] | \[4\] | \[4\] |
| \[y\] | \[1\] | \[ - 1\] | \[2\] | \[ - 2\] | \[3\] | \[ - 3\] | \[4\] | \[ - 4\] |
Let’s plot a graph for these coordinates,we take scale x-axis= 1 unit = 1 units and y-axis= 1 unit = 1 units.
For \[y > - 1\], we can see in the graph that we have a straight horizontal line that crosses the y axis at \[ - 1\]. The solution is all the coordinate points above the line \[y = - 1\]. For \[x \geqslant 4\], we can see in the graph that we have a straight vertical line that crosses the x axis at \[4\]. The solution is all the coordinate points right to the line \[x = 4\]. In the above graph the shaded region is the solution of the given inequality.
Note: We don’t take points lying on the line \[y = - 1\] for the inequality \[y > - 1\]. We take the point that lies on the line \[x = 4\] for the inequality \[x \geqslant 4\]. A graph shows the relation between two variable quantities, it contains two axes perpendicular to each other namely the x-axis and the y-axis. Each variable is measured along one of the axes. In the question, we are given one linear equation containing two variables namely x and y, x is measured along the x-axis and y is measured along the y-axis while tracing the given equations.

Recently Updated Pages
Master Class 8 Social Science: Engaging Questions & Answers for Success
Master Class 8 English: Engaging Questions & Answers for Success
Class 8 Question and Answer - Your Ultimate Solutions Guide
Master Class 8 Maths: Engaging Questions & Answers for Success
Master Class 8 Science: Engaging Questions & Answers for Success
Master Class 7 English: Engaging Questions & Answers for Success
Trending doubts
Difference Between Plant Cell and Animal Cell
Fill the blanks with the suitable prepositions 1 The class 9 english CBSE
Who is eligible for RTE class 9 social science CBSE
Which places in India experience sunrise first and class 9 social science CBSE
What is pollution? How many types of pollution? Define it
Name 10 Living and Non living things class 9 biology CBSE