


Graph the function $x + 2y = - 2.$
Answer
576.6k+ views
Hint:For plotting a graph we need different x values as well as their corresponding y values. Such that to solve this question we need to find the x intercept, y intercept and some intermediate values. Also the x-intercept and y-intercept can be found by substituting y=0 and x=0 respectively. After finding these values we just need to plot them on the XY plane.
Complete step by step solution:
Given
$x + 2y = - 2.......................\left( i \right)$
Now we need to find the x intercept, y intercept and some intermediate values for plotting the graph. X intercept is the point where the graph touches X axis such that y=0, such that substituting y=0 in (i):
\[
\Rightarrow x + 2y = - 2. \\
\Rightarrow x + 0 = - 2 \\
\Rightarrow x = - 2.................\left( {ii} \right) \\
\]
\[\therefore {\text{x intercept}} = \left( { - 2,0} \right)\]
Now we need to find y intercept:
So we have to put x=0 in (i) since y intercept is the point where the graph touches the Y axis.
$
\Rightarrow x + 2y = - 2. \\
\Rightarrow 0 + 2y = - 2 \\
\Rightarrow y = - 1...................\left( {iii} \right) \\
$
\[\therefore y{\text{ intercept}} = \left( {0, - 1} \right)\]
Now let’s find some intermediate points:
For x=1:
$
\Rightarrow x + 2y = - 2. \\
\Rightarrow 1 + 2y = - 2 \\
\Rightarrow 2y = - 3 \\
\Rightarrow y = - \left( {\dfrac{3}{2}} \right) \\
\Rightarrow y = - 1.5 \\
$
$\therefore \left( {1,\; - 1.5} \right)\;{\text{is}}\;{\text{a}}\;{\text{point}}{\text{.}}$
For x=-1
$
\Rightarrow x + 2y = - 2. \\
\Rightarrow - 1 + 2y = - 2 \\
\Rightarrow 2y = - 1 \\
\Rightarrow y = - \left( {\dfrac{1}{2}} \right) \\
\Rightarrow y = - 0.5 \\
$
\[\therefore \left( { - 1,\; - 0.5} \right)\;{\text{is}}\;{\text{a}}\;{\text{point}}{\text{.}}\]
Now all these values which we have got from above is to be plotted in a XY plane.
Plotting the points \[\left( { - 2,0} \right),\left( {0, - 1} \right),\left( {1, - 1.5} \right),\left( { - 1, - 0.5} \right)\]
On plotting the above points we get the following graph:
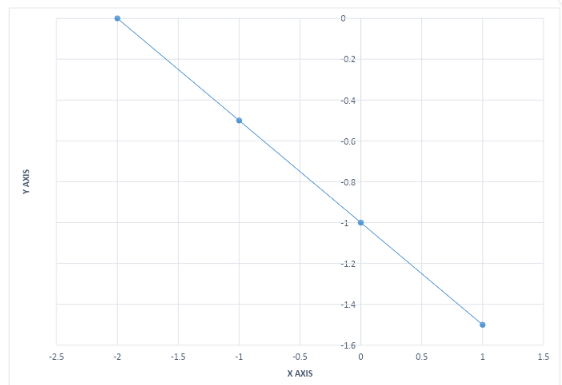
The above graph shows the plot of $x + 2y = - 2.$
Note: While approaching similar graphical questions one should find as many points as possible from the given conditions and common knowledge. Also one must be careful while doing the solution. Also while plotting the graph one must choose appropriate scale considering the values that should be plotted such that our every value can be
represented on the graph.
Complete step by step solution:
Given
$x + 2y = - 2.......................\left( i \right)$
Now we need to find the x intercept, y intercept and some intermediate values for plotting the graph. X intercept is the point where the graph touches X axis such that y=0, such that substituting y=0 in (i):
\[
\Rightarrow x + 2y = - 2. \\
\Rightarrow x + 0 = - 2 \\
\Rightarrow x = - 2.................\left( {ii} \right) \\
\]
\[\therefore {\text{x intercept}} = \left( { - 2,0} \right)\]
Now we need to find y intercept:
So we have to put x=0 in (i) since y intercept is the point where the graph touches the Y axis.
$
\Rightarrow x + 2y = - 2. \\
\Rightarrow 0 + 2y = - 2 \\
\Rightarrow y = - 1...................\left( {iii} \right) \\
$
\[\therefore y{\text{ intercept}} = \left( {0, - 1} \right)\]
Now let’s find some intermediate points:
For x=1:
$
\Rightarrow x + 2y = - 2. \\
\Rightarrow 1 + 2y = - 2 \\
\Rightarrow 2y = - 3 \\
\Rightarrow y = - \left( {\dfrac{3}{2}} \right) \\
\Rightarrow y = - 1.5 \\
$
$\therefore \left( {1,\; - 1.5} \right)\;{\text{is}}\;{\text{a}}\;{\text{point}}{\text{.}}$
For x=-1
$
\Rightarrow x + 2y = - 2. \\
\Rightarrow - 1 + 2y = - 2 \\
\Rightarrow 2y = - 1 \\
\Rightarrow y = - \left( {\dfrac{1}{2}} \right) \\
\Rightarrow y = - 0.5 \\
$
\[\therefore \left( { - 1,\; - 0.5} \right)\;{\text{is}}\;{\text{a}}\;{\text{point}}{\text{.}}\]
Now all these values which we have got from above is to be plotted in a XY plane.
Plotting the points \[\left( { - 2,0} \right),\left( {0, - 1} \right),\left( {1, - 1.5} \right),\left( { - 1, - 0.5} \right)\]
| X | Y |
| -2 | 1 |
| 0 | -1 |
| 1 | -1.5 |
| -1 | -0.5 |
On plotting the above points we get the following graph:
The above graph shows the plot of $x + 2y = - 2.$
Note: While approaching similar graphical questions one should find as many points as possible from the given conditions and common knowledge. Also one must be careful while doing the solution. Also while plotting the graph one must choose appropriate scale considering the values that should be plotted such that our every value can be
represented on the graph.
Recently Updated Pages
Three beakers labelled as A B and C each containing 25 mL of water were taken A small amount of NaOH anhydrous CuSO4 and NaCl were added to the beakers A B and C respectively It was observed that there was an increase in the temperature of the solutions contained in beakers A and B whereas in case of beaker C the temperature of the solution falls Which one of the following statements isarecorrect i In beakers A and B exothermic process has occurred ii In beakers A and B endothermic process has occurred iii In beaker C exothermic process has occurred iv In beaker C endothermic process has occurred
Master Class 11 Social Science: Engaging Questions & Answers for Success
Master Class 11 Physics: Engaging Questions & Answers for Success
Master Class 11 Maths: Engaging Questions & Answers for Success
Master Class 11 Economics: Engaging Questions & Answers for Success
Master Class 11 Computer Science: Engaging Questions & Answers for Success
Three beakers labelled as A B and C each containing 25 mL of water were taken A small amount of NaOH anhydrous CuSO4 and NaCl were added to the beakers A B and C respectively It was observed that there was an increase in the temperature of the solutions contained in beakers A and B whereas in case of beaker C the temperature of the solution falls Which one of the following statements isarecorrect i In beakers A and B exothermic process has occurred ii In beakers A and B endothermic process has occurred iii In beaker C exothermic process has occurred iv In beaker C endothermic process has occurred
Master Class 11 Social Science: Engaging Questions & Answers for Success
Master Class 11 Physics: Engaging Questions & Answers for Success
Trending doubts
One Metric ton is equal to kg A 10000 B 1000 C 100 class 11 physics CBSE
There are 720 permutations of the digits 1 2 3 4 5 class 11 maths CBSE
State and prove Bernoullis theorem class 11 physics CBSE
Draw a diagram of a plant cell and label at least eight class 11 biology CBSE
Difference Between Prokaryotic Cells and Eukaryotic Cells
Discuss the various forms of bacteria class 11 biology CBSE