


How do you graph \[F(x,y) = \sqrt {{x^2} + {y^2} - 1} + \ln (4 - {x^2} - {y^2})\] ?
Answer
558.9k+ views
Hint: In the above given equation \[F(x,y) = \sqrt {{x^2} + {y^2} - 1} + \ln (4 - {x^2} - {y^2})\] we will observe two independent variables \[x\] and \[y\] . Now we will replace these variables \[x\] and \[y\] as \[r\] so \[F(x,y) = f(r)\] m also denoted as \[z\] .In order to plot the graph we need to convert the equation in polar form. Later on we will sketch a two dimensional graph for \[z = \sqrt {{r^2} - 1} + \ln (4 - {r^2})\] and finally we will rotate it about \[z\] axis.
Complete step-by-step answer:
As we know that in the above problem for which we need to sketch the graph consists of the given function which we have is
\[F(x,y) = \sqrt {{x^2} + {y^2} - 1} + \ln (4 - {x^2} - {y^2})\]
Here we will observe that \[F\] is the given function of the independent variables \[x\] and \[y\] .
Now we will let \[\sum {} \] be the surface of the given function \[F\]
Here it the \[F(x,y) = f(r)\] in which
\[r = \sqrt {{x^2} + {y^2}} \]
Precisely we will observe that
\[f(r) = \sqrt {{r^2} - 1} + \ln (4 - {r^2})\]
Or \[z = \sqrt {{r^2} - 1} + \ln (4 - {r^2})\]
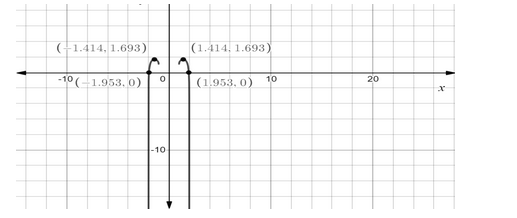
Now if we will revolve the graph around the \[z\] axis we will get the graph of the given function as a surface of revolution. Hence the graph of the given function is sketched
Note: By substituting the values and equating it keeping the equation balanced we can draw the graph for the given equation.
Notes: The graph which is obtained in the above equation is the 3-Dimensional graph as it shows involvement of three variables \[x,y{\text{ }}and{\text{ }}z\] . It is difficult to obtain these kinds of 3-Dimensional graphs through simple derivatives and coordinate concepts .To draw this graph knowledge of advanced mathematics concepts like solids of revolution is required.
Complete step-by-step answer:
As we know that in the above problem for which we need to sketch the graph consists of the given function which we have is
\[F(x,y) = \sqrt {{x^2} + {y^2} - 1} + \ln (4 - {x^2} - {y^2})\]
Here we will observe that \[F\] is the given function of the independent variables \[x\] and \[y\] .
Now we will let \[\sum {} \] be the surface of the given function \[F\]
Here it the \[F(x,y) = f(r)\] in which
\[r = \sqrt {{x^2} + {y^2}} \]
Precisely we will observe that
\[f(r) = \sqrt {{r^2} - 1} + \ln (4 - {r^2})\]
Or \[z = \sqrt {{r^2} - 1} + \ln (4 - {r^2})\]
Now if we will revolve the graph around the \[z\] axis we will get the graph of the given function as a surface of revolution. Hence the graph of the given function is sketched
Note: By substituting the values and equating it keeping the equation balanced we can draw the graph for the given equation.
Notes: The graph which is obtained in the above equation is the 3-Dimensional graph as it shows involvement of three variables \[x,y{\text{ }}and{\text{ }}z\] . It is difficult to obtain these kinds of 3-Dimensional graphs through simple derivatives and coordinate concepts .To draw this graph knowledge of advanced mathematics concepts like solids of revolution is required.
Recently Updated Pages
Master Class 12 Social Science: Engaging Questions & Answers for Success
Master Class 12 Physics: Engaging Questions & Answers for Success
Master Class 12 Maths: Engaging Questions & Answers for Success
Master Class 12 Economics: Engaging Questions & Answers for Success
Master Class 12 Chemistry: Engaging Questions & Answers for Success
Master Class 12 Business Studies: Engaging Questions & Answers for Success
Trending doubts
Which are the Top 10 Largest Countries of the World?
Draw a labelled sketch of the human eye class 12 physics CBSE
Explain the structure of megasporangium class 12 biology CBSE
What are the major means of transport Explain each class 12 social science CBSE
How many chromosomes are found in human ovum a 46 b class 12 biology CBSE
The diagram of the section of a maize grain is given class 12 biology CBSE