


How do you graph \[3x - y = 8\] by plotting points?
Answer
579.3k+ views
Hint: To graph the given equation with the help of plotting points method, you have to first find some points or coordinates of some points lying on the graph of the given equation. You can find the coordinates by putting the values of any variable in the equation and solve for the other one, in this way you will get coordinates. After getting coordinates, plot them on a graph paper and then join all the points and extend it to get the required graph.
Complete step-by-step answer:
In order to graph the given equation of a straight line, that is \[3x - y = 8\] with the help of plotting points method, we will find some points lying on the graph of the given equation. And for that we will take random values of $ x $ and put it in the equation and solve for values of $ y $ in the table below:
We can write the given equation \[3x - y = 8\] as follows:
\[
\Rightarrow 3x - y = 8 \\
\Rightarrow y = 3x - 8 \\
\]
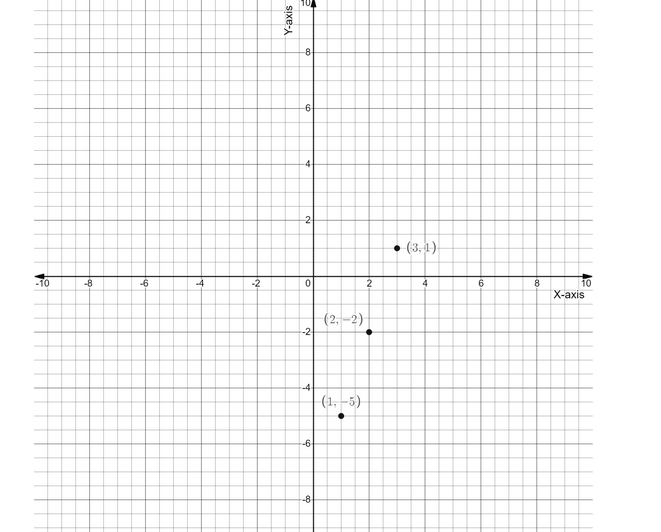
So we get some points, now plotting them on a graph paper or the coordinate graph, we will get
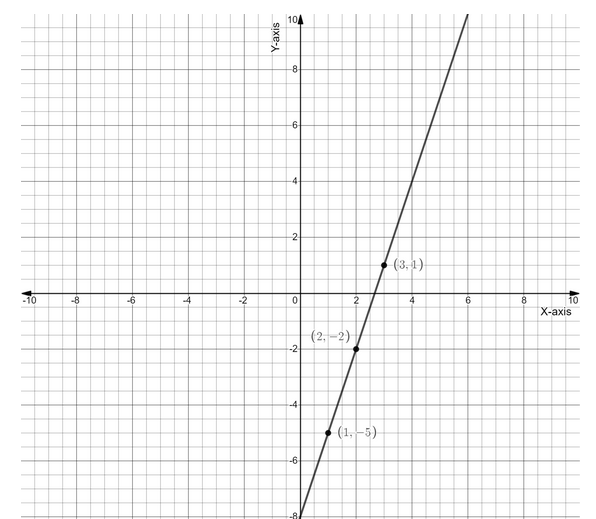
Now, joining the points and extending it, we will get
Therefore this is the required graph of the given equation.
Note: When using plotting the points method, try to take the numbers to find the coordinates of the points such that the coordinates comes as a whole number not in fraction and if not coming in whole number then try to find coordinates as absolute fractions. This helps you make the graph accurate.
Complete step-by-step answer:
In order to graph the given equation of a straight line, that is \[3x - y = 8\] with the help of plotting points method, we will find some points lying on the graph of the given equation. And for that we will take random values of $ x $ and put it in the equation and solve for values of $ y $ in the table below:
We can write the given equation \[3x - y = 8\] as follows:
\[
\Rightarrow 3x - y = 8 \\
\Rightarrow y = 3x - 8 \\
\]
| $ x $ | $ y = 3x - 8 $ | Coordinate of the points $ (x,\;y) $ |
| $ 1 $ | $ - 5 $ | $ (1,\; - 5) $ |
| $ 2 $ | $ - 2 $ | $ (2,\; - 2) $ |
| $ 3 $ | $ 1 $ | $ ( - 3,\;1) $ |
So we get some points, now plotting them on a graph paper or the coordinate graph, we will get
Now, joining the points and extending it, we will get
Therefore this is the required graph of the given equation.
Note: When using plotting the points method, try to take the numbers to find the coordinates of the points such that the coordinates comes as a whole number not in fraction and if not coming in whole number then try to find coordinates as absolute fractions. This helps you make the graph accurate.

Recently Updated Pages
Master Class 11 English: Engaging Questions & Answers for Success
Master Class 11 Social Science: Engaging Questions & Answers for Success
Master Class 11 Maths: Engaging Questions & Answers for Success
Master Class 11 Biology: Engaging Questions & Answers for Success
Master Class 11 Physics: Engaging Questions & Answers for Success
Master Class 11 Chemistry: Engaging Questions & Answers for Success
Trending doubts
What is BLO What is the full form of BLO class 8 social science CBSE
Which Indian state shares the longest international class 8 social science CBSE
Citizens of India can vote at the age of A 18 years class 8 social science CBSE
In Indian rupees 1 trillion is equal to how many c class 8 maths CBSE
What is persistence of vision
Full form of STD, ISD and PCO