


Given below are the seats won by different political parties in the polling outcomes of a state assembly elections:
Political Party A B C D E F Seats won 75 55 37 29 10 37
\[\left( i \right)\] Draw a bar graph to represent the polling results.
\[\left( {ii} \right)\] Which political party won the maximum number of seats?
| Political Party | A | B | C | D | E | F |
| Seats won | 75 | 55 | 37 | 29 | 10 | 37 |
Answer
519.9k+ views
Hint: To draw a bar graph to represent the polling results we will first plot the political parties on the x-axis and seats won by different political parties on the y-axis. Then we will use vertical bars for each of the political parties which will represent the seats won by them. Plotting all vertical bars for all the parties will give us the required bar graph.
Complete step-by-step answer:
From the given question we know,
Seats won by political party A are \[75\].
Seats won by political party B are \[55\].
Seats won by political party C are \[37\].
Seats won by political party D are \[29\].
Seats won by political party E are \[10\].
Seats won by political party F are \[37\].
Bar graph normally shows categorical and numeric variables arranged in class intervals.
We will plot bars of uniform width of different political parties on the x-axis and the seats won by different political parties on the y-axis.
The height of each bar will denote the number of seats won by the corresponding party.
Therefore,
\[\left( i \right)\] Bar graph to represent the polling results is given as follows,
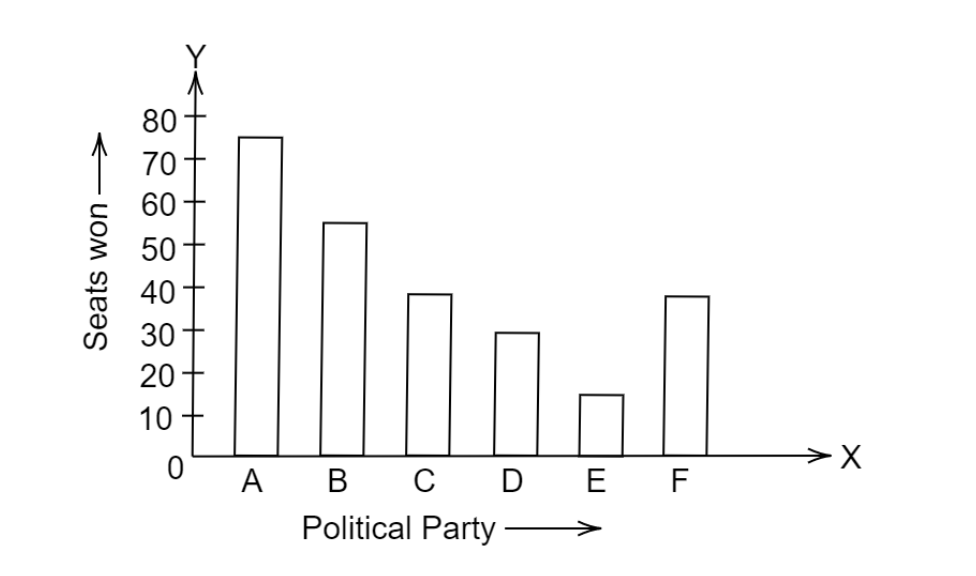
\[\left( {ii} \right)\]Here, we can see from the bar graph that among all the bars, the height of bar A is maximum. Hence, party A won the maximum number of seats.
Note: One important point is that bars are of uniform width. Usually, Bar graphs are used to display categorical data, that is known as the data that fits into categories. Also, note that bar graphs can be horizontal or vertical but the primary feature of a bar graph is its height. If the length of the bar graph is more, then the values are greater of any given data.
Complete step-by-step answer:
From the given question we know,
Seats won by political party A are \[75\].
Seats won by political party B are \[55\].
Seats won by political party C are \[37\].
Seats won by political party D are \[29\].
Seats won by political party E are \[10\].
Seats won by political party F are \[37\].
Bar graph normally shows categorical and numeric variables arranged in class intervals.
We will plot bars of uniform width of different political parties on the x-axis and the seats won by different political parties on the y-axis.
The height of each bar will denote the number of seats won by the corresponding party.
Therefore,
\[\left( i \right)\] Bar graph to represent the polling results is given as follows,
\[\left( {ii} \right)\]Here, we can see from the bar graph that among all the bars, the height of bar A is maximum. Hence, party A won the maximum number of seats.
Note: One important point is that bars are of uniform width. Usually, Bar graphs are used to display categorical data, that is known as the data that fits into categories. Also, note that bar graphs can be horizontal or vertical but the primary feature of a bar graph is its height. If the length of the bar graph is more, then the values are greater of any given data.
Recently Updated Pages
Master Class 12 Business Studies: Engaging Questions & Answers for Success
Master Class 12 Biology: Engaging Questions & Answers for Success
Master Class 12 Chemistry: Engaging Questions & Answers for Success
Class 12 Question and Answer - Your Ultimate Solutions Guide
Master Class 11 Social Science: Engaging Questions & Answers for Success
Master Class 11 English: Engaging Questions & Answers for Success
Trending doubts
What is the Full Form of ICSE / ISC ?
Find the sum of series 1 + 2 + 3 + 4 + 5 + + 100 class 9 maths CBSE
What is the situation called when no party gets the class 9 social science CBSE
Fill the blanks with the suitable prepositions 1 The class 9 english CBSE
Difference Between Plant Cell and Animal Cell
How many hours before the closure of election must class 9 social science CBSE