


From the graph given, at what time the number of living bacteria is increasing at the greatest rate?
(a) During the first 2 hours
(b) Between the 2nd and the 4th hour
(c) Between the 4th and the 6th hour
(d) Between the 11th and 13th hour
Answer
530.7k+ views
Hint: The maximum growth rate of almost all the biological cells will be observed during the exponential growth phase. In this case, the number of bacteria increases between the time intervals whose least common multiple (L.C.M.) is 6.
Complete answer:
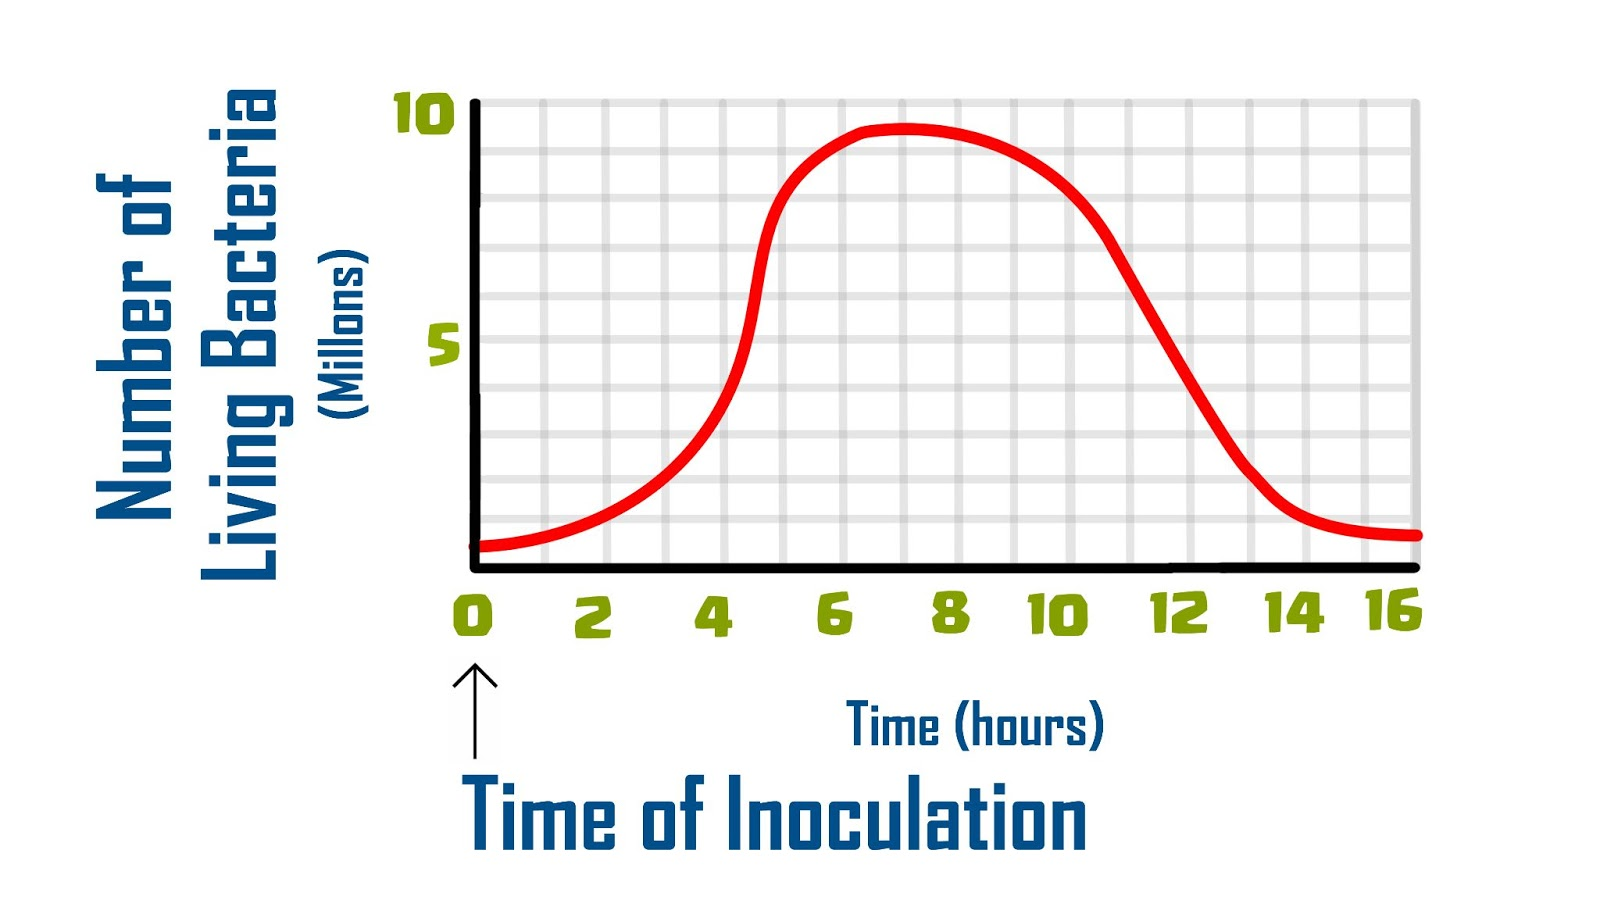
The highest growth rate of bacteria is seen in the exponential phase. The graph given log phase is between the 4th and the 6th hour.
-In the lag phase, the bacteria will adapt themselves to the new conditions. In this graph, the lag phase is observed between the 2nd hour and 4th hour.
-During the stationary phase, there will be no increase in the number of new bacterial cells formed. In the given graph the stationary phase is observed between the 6th and 10th hour.
-The death phase is observed between the 11th and 13th hour.
The graph of the growth curve in plants will be sigmoidal in shape. The growth curve is characterized by 4 different phases as mentioned below.
Lag phase: The biological systems experience an initial phase that exhibits a slow-growing process. This is called the 'lag phase.' During the lag phase, the cells will prepare themselves for cell division.
Log phase: The log phase is characterized by the actual cell division and it increases the number of cells. It is also called an exponential phase. Here the daughter cells begin to divide after the mitotic cell division. The number of live cells will be maximum in the log phase. Thus it can be observed that there will be a steep rise in the graph from the lag phase to the log phase.
Exponential phase: The cell growth gradually slows down due to the limited supply of nutrients (nutrients will be used up for the cell growth and hence the cells will become devoid of nutrients), giving rise to the 'stationary period.' During the stationary phase, the number of new cells formed will be equal to the number of cells that die.
Death phase: During the death phase, the cells will become senescent (old) and will eventually die. When we plot a graph for growth (number of bacteria) vs time, we get a sigmoidal curve or S-curve. This growth curve is characteristic of all cells, tissues, organs, and is representative of an organism that lives in a natural environment.
The below image represents the growth curve.
So, the correct answer is ‘Between the 4th and the 6th hour’.
Note: The time of generation varies among different bacteria, which is controlled by several environmental conditions and by the bacterial nature. For example, one of the fastest-growing bacteria, Clostridium perfringens has an optimum generation time of around 10 minutes; Escherichia coli can double every 20 minutes, and some soil bacteria situated deep inside Earth’s crust have a generation time of several thousand years. The growth rate also depends upon the growth medium provided in the lab conditions.
Complete answer:
The highest growth rate of bacteria is seen in the exponential phase. The graph given log phase is between the 4th and the 6th hour.
-In the lag phase, the bacteria will adapt themselves to the new conditions. In this graph, the lag phase is observed between the 2nd hour and 4th hour.
-During the stationary phase, there will be no increase in the number of new bacterial cells formed. In the given graph the stationary phase is observed between the 6th and 10th hour.
-The death phase is observed between the 11th and 13th hour.
The graph of the growth curve in plants will be sigmoidal in shape. The growth curve is characterized by 4 different phases as mentioned below.
Lag phase: The biological systems experience an initial phase that exhibits a slow-growing process. This is called the 'lag phase.' During the lag phase, the cells will prepare themselves for cell division.
Log phase: The log phase is characterized by the actual cell division and it increases the number of cells. It is also called an exponential phase. Here the daughter cells begin to divide after the mitotic cell division. The number of live cells will be maximum in the log phase. Thus it can be observed that there will be a steep rise in the graph from the lag phase to the log phase.
Exponential phase: The cell growth gradually slows down due to the limited supply of nutrients (nutrients will be used up for the cell growth and hence the cells will become devoid of nutrients), giving rise to the 'stationary period.' During the stationary phase, the number of new cells formed will be equal to the number of cells that die.
Death phase: During the death phase, the cells will become senescent (old) and will eventually die. When we plot a graph for growth (number of bacteria) vs time, we get a sigmoidal curve or S-curve. This growth curve is characteristic of all cells, tissues, organs, and is representative of an organism that lives in a natural environment.
The below image represents the growth curve.
So, the correct answer is ‘Between the 4th and the 6th hour’.
Note: The time of generation varies among different bacteria, which is controlled by several environmental conditions and by the bacterial nature. For example, one of the fastest-growing bacteria, Clostridium perfringens has an optimum generation time of around 10 minutes; Escherichia coli can double every 20 minutes, and some soil bacteria situated deep inside Earth’s crust have a generation time of several thousand years. The growth rate also depends upon the growth medium provided in the lab conditions.
Recently Updated Pages
Three beakers labelled as A B and C each containing 25 mL of water were taken A small amount of NaOH anhydrous CuSO4 and NaCl were added to the beakers A B and C respectively It was observed that there was an increase in the temperature of the solutions contained in beakers A and B whereas in case of beaker C the temperature of the solution falls Which one of the following statements isarecorrect i In beakers A and B exothermic process has occurred ii In beakers A and B endothermic process has occurred iii In beaker C exothermic process has occurred iv In beaker C endothermic process has occurred
Master Class 11 Social Science: Engaging Questions & Answers for Success
Master Class 11 Physics: Engaging Questions & Answers for Success
Master Class 11 Maths: Engaging Questions & Answers for Success
Master Class 11 Economics: Engaging Questions & Answers for Success
Master Class 11 Computer Science: Engaging Questions & Answers for Success
Three beakers labelled as A B and C each containing 25 mL of water were taken A small amount of NaOH anhydrous CuSO4 and NaCl were added to the beakers A B and C respectively It was observed that there was an increase in the temperature of the solutions contained in beakers A and B whereas in case of beaker C the temperature of the solution falls Which one of the following statements isarecorrect i In beakers A and B exothermic process has occurred ii In beakers A and B endothermic process has occurred iii In beaker C exothermic process has occurred iv In beaker C endothermic process has occurred
Master Class 11 Social Science: Engaging Questions & Answers for Success
Master Class 11 Physics: Engaging Questions & Answers for Success
Trending doubts
One Metric ton is equal to kg A 10000 B 1000 C 100 class 11 physics CBSE
There are 720 permutations of the digits 1 2 3 4 5 class 11 maths CBSE
State and prove Bernoullis theorem class 11 physics CBSE
Draw a diagram of a plant cell and label at least eight class 11 biology CBSE
Difference Between Prokaryotic Cells and Eukaryotic Cells
Discuss the various forms of bacteria class 11 biology CBSE