


How do you find the graph of \[y=x\cos \left( \dfrac{1}{x} \right)\]?
Answer
544.5k+ views
Hint: In this question, we are going to find the variables like amplitude, period phase shift , and vertical shift for this function ,y. After that we are going to find the various points, by finding the different values of the function at different values of x.
Formula used:
The formula that is used to find the variables is in the form \[a\cos \left( bx-c \right)+d\]
Amplitude, \[\left| a \right|=x\]
For Period, \[\Rightarrow \dfrac{2\pi }{\left| b \right|}\]
Finding the phase shift using the formula \[\dfrac{c}{b}\]
Complete step by step solution:
In order to find the graph, we firstly use the form \[a\cos \left( bx-c \right)+d\],then ,we find the variables that are used to find the amplitude ,period, phase shift and vertical shift.
\[\begin{align}
& a=x \\
& b=\dfrac{1}{1} \\
& c=0 \\
& d=0 \\
\end{align}\]
Finding the amplitude \[\left| a \right|=x\]
Find the period using formula
\[\begin{align}
& \Rightarrow \dfrac{2\pi }{\left| b \right|} \\
& \Rightarrow \dfrac{2\pi }{\left| \dfrac{1}{1} \right|} \\
\end{align}\]
Solving the equation
The absolute value is the distance at which a number is from zero. The distance between 0 and \[\dfrac{1}{1}\] is\[1\].
Finding the phase shift using the formula \[\dfrac{c}{b}\]
\[\Rightarrow \] phase shift : \[\dfrac{0}{\dfrac{1}{1}}\]
Cancelling the common factor, \[1\]
Therefore, phase shift:
\[\begin{align}
& \dfrac{0}{1} \\
& \Rightarrow 0 \\
\end{align}\]
Finding the vertical shift:
Vertical shift: \[0\]
So, the properties of the trigonometric function.
Amplitude: \[x\]
Period: \[2\pi \]
Phase shift: \[0\]
Vertical shift: \[0\]
Choosing a few points to plot the graph.
For the point at \[x=\dfrac{\pi }{2}\]
\[\Rightarrow f\left( \dfrac{\pi }{2} \right)=\dfrac{\pi }{2}\cos \left( \dfrac{1}{\dfrac{\pi }{2}} \right)\]
Solving this, we get,
\[f\left( \dfrac{\pi }{2} \right)=1.2630\]
For, \[x=\pi \]
\[\begin{align}
& \Rightarrow f\left( \pi \right)=\pi \cos \left( \dfrac{1}{\pi } \right) \\
& \Rightarrow f\left( \pi \right)=2.9835 \\
\end{align}\]
For, \[x=\dfrac{3\pi }{2}\]
\[\begin{align}
& \Rightarrow f\left( \dfrac{3\pi }{2} \right)=\dfrac{3\pi }{2}\cos \left( \dfrac{1}{\dfrac{3\pi }{2}} \right) \\
& \Rightarrow f\left( \dfrac{3\pi }{2} \right)=4.6063 \\
\end{align}\]
For, \[x=2\pi \]
\[\begin{align}
& \Rightarrow f\left( 2\pi \right)=2\pi \cos \left( \dfrac{1}{2\pi } \right) \\
& \Rightarrow f\left( 2\pi \right)=6.2033 \\
\end{align}\]
For, \[x=\dfrac{5\pi }{2}\]
\[\begin{align}
& \Rightarrow f\left( \dfrac{5\pi }{2} \right)=\dfrac{5\pi }{2}\cos \left( \dfrac{1}{\dfrac{5\pi }{2}} \right) \\
& \Rightarrow f\left( \dfrac{5\pi }{2} \right)=7.7903 \\
\end{align}\]
Graph:
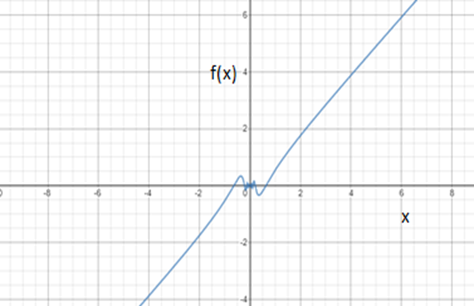
Note: The graph is a straight line with a slope for all the values both for positive x-axis and the negative x-axis. However when x approaches to zero, the discontinuity in the graph occurs. As it can be seen in the graph, there is a kind of kink at the values near zero. This is because the value of cosine becomes undefined near zero.
Formula used:
The formula that is used to find the variables is in the form \[a\cos \left( bx-c \right)+d\]
Amplitude, \[\left| a \right|=x\]
For Period, \[\Rightarrow \dfrac{2\pi }{\left| b \right|}\]
Finding the phase shift using the formula \[\dfrac{c}{b}\]
Complete step by step solution:
In order to find the graph, we firstly use the form \[a\cos \left( bx-c \right)+d\],then ,we find the variables that are used to find the amplitude ,period, phase shift and vertical shift.
\[\begin{align}
& a=x \\
& b=\dfrac{1}{1} \\
& c=0 \\
& d=0 \\
\end{align}\]
Finding the amplitude \[\left| a \right|=x\]
Find the period using formula
\[\begin{align}
& \Rightarrow \dfrac{2\pi }{\left| b \right|} \\
& \Rightarrow \dfrac{2\pi }{\left| \dfrac{1}{1} \right|} \\
\end{align}\]
Solving the equation
The absolute value is the distance at which a number is from zero. The distance between 0 and \[\dfrac{1}{1}\] is\[1\].
Finding the phase shift using the formula \[\dfrac{c}{b}\]
\[\Rightarrow \] phase shift : \[\dfrac{0}{\dfrac{1}{1}}\]
Cancelling the common factor, \[1\]
Therefore, phase shift:
\[\begin{align}
& \dfrac{0}{1} \\
& \Rightarrow 0 \\
\end{align}\]
Finding the vertical shift:
Vertical shift: \[0\]
So, the properties of the trigonometric function.
Amplitude: \[x\]
Period: \[2\pi \]
Phase shift: \[0\]
Vertical shift: \[0\]
Choosing a few points to plot the graph.
For the point at \[x=\dfrac{\pi }{2}\]
\[\Rightarrow f\left( \dfrac{\pi }{2} \right)=\dfrac{\pi }{2}\cos \left( \dfrac{1}{\dfrac{\pi }{2}} \right)\]
Solving this, we get,
\[f\left( \dfrac{\pi }{2} \right)=1.2630\]
For, \[x=\pi \]
\[\begin{align}
& \Rightarrow f\left( \pi \right)=\pi \cos \left( \dfrac{1}{\pi } \right) \\
& \Rightarrow f\left( \pi \right)=2.9835 \\
\end{align}\]
For, \[x=\dfrac{3\pi }{2}\]
\[\begin{align}
& \Rightarrow f\left( \dfrac{3\pi }{2} \right)=\dfrac{3\pi }{2}\cos \left( \dfrac{1}{\dfrac{3\pi }{2}} \right) \\
& \Rightarrow f\left( \dfrac{3\pi }{2} \right)=4.6063 \\
\end{align}\]
For, \[x=2\pi \]
\[\begin{align}
& \Rightarrow f\left( 2\pi \right)=2\pi \cos \left( \dfrac{1}{2\pi } \right) \\
& \Rightarrow f\left( 2\pi \right)=6.2033 \\
\end{align}\]
For, \[x=\dfrac{5\pi }{2}\]
\[\begin{align}
& \Rightarrow f\left( \dfrac{5\pi }{2} \right)=\dfrac{5\pi }{2}\cos \left( \dfrac{1}{\dfrac{5\pi }{2}} \right) \\
& \Rightarrow f\left( \dfrac{5\pi }{2} \right)=7.7903 \\
\end{align}\]
| \[x\] | \[f\left( x \right)\] |
| \[\dfrac{\pi }{2}\] | \[1.2630\] |
| \[\pi \] | \[2.9835\] |
| \[\dfrac{3\pi }{2}\] | \[4.6063\] |
| \[2\pi \] | \[6.2033\] |
| \[\dfrac{5\pi }{2}\] | \[7.7903\] |
Graph:
Note: The graph is a straight line with a slope for all the values both for positive x-axis and the negative x-axis. However when x approaches to zero, the discontinuity in the graph occurs. As it can be seen in the graph, there is a kind of kink at the values near zero. This is because the value of cosine becomes undefined near zero.
Recently Updated Pages
Master Class 12 Economics: Engaging Questions & Answers for Success
Master Class 12 Physics: Engaging Questions & Answers for Success
Master Class 12 English: Engaging Questions & Answers for Success
Master Class 12 Social Science: Engaging Questions & Answers for Success
Master Class 12 Maths: Engaging Questions & Answers for Success
Master Class 12 Business Studies: Engaging Questions & Answers for Success
Trending doubts
Which are the Top 10 Largest Countries of the World?
What are the major means of transport Explain each class 12 social science CBSE
Draw a labelled sketch of the human eye class 12 physics CBSE
Why cannot DNA pass through cell membranes class 12 biology CBSE
Differentiate between insitu conservation and exsitu class 12 biology CBSE
Draw a neat and well labeled diagram of TS of ovary class 12 biology CBSE