


Find \[A\Delta B\] and draw Venn diagram when: \[A = \left\{ {1,4,7,8} \right\}\] and \[B = \left\{ {4,8,6,9} \right\}\].
Answer
591.3k+ views
Hint:
Here we will firstly find the value of the whole set of numbers i.e. union of both the set. Then we will find the value of only the common number between \[A\] and \[B\] i.e. the intersection of both the sets. Then we will subtract intersection from the union of the set to get the value of \[A\Delta B\]. Then we will draw the Venn diagram for it.
Complete step by step solution:
Given sets are \[A = \left\{ {1,4,7,8} \right\}\] and \[B = \left\{ {4,8,6,9} \right\}\].
Firstly we will find the value of whole set of number i.e. \[A \cup B\]. Therefore, we get
\[A \cup B = \left\{ {1,4,7,8} \right\} \cup \left\{ {4,8,6,9} \right\} = \left\{ {1,4,7,6,8,9} \right\}\]
Then we will find the value of only common number between \[A\] and \[B\] i.e. \[A \cap B\]. Therefore, we get
\[A \cap B = \left\{ {1,4,7,8} \right\} \cap \left\{ {4,8,6,9} \right\} = \left\{ {4,8} \right\}\]
Now we will find the value of \[A\Delta B\] which is the set of numbers which occur only in one particular set. Therefore, by subtracting \[A \cap B\] from \[A \cup B\] to get the value of \[A\Delta B\], we get
\[A\Delta B = A \cup B - A \cap B = \left\{ {1,4,7,6,8,9} \right\} - \left\{ {4,8} \right\} = \left\{ {1,7,6,9} \right\}\]
Hence the value of \[A\Delta B\] is \[\left\{ {1,7,6,9} \right\}\]
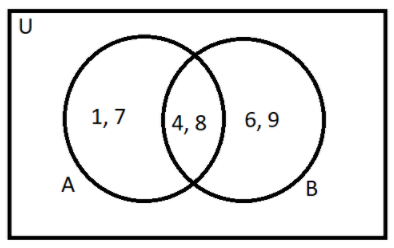
Now we will draw the Venn diagram of the given sets. Therefore, we get
Note:
Venn diagram is the diagram which shows all the possible relations between different sets of data. Venn diagrams are also termed as the primary diagram or logic diagram or set diagram. The area intersected by two circles is the area for the elements which are common in those two groups or sets. We should draw the Venn diagram carefully and keep in mind that in the common region the data may not repeat. The set which includes all the elements from every set of data is denoted as \[A \cup B\]. The set which includes only common terms between the given sets is generally denoted as \[A \cap B\]. Venn diagrams are generally used for showing some relation between different things or different groups of things or items.
Here we will firstly find the value of the whole set of numbers i.e. union of both the set. Then we will find the value of only the common number between \[A\] and \[B\] i.e. the intersection of both the sets. Then we will subtract intersection from the union of the set to get the value of \[A\Delta B\]. Then we will draw the Venn diagram for it.
Complete step by step solution:
Given sets are \[A = \left\{ {1,4,7,8} \right\}\] and \[B = \left\{ {4,8,6,9} \right\}\].
Firstly we will find the value of whole set of number i.e. \[A \cup B\]. Therefore, we get
\[A \cup B = \left\{ {1,4,7,8} \right\} \cup \left\{ {4,8,6,9} \right\} = \left\{ {1,4,7,6,8,9} \right\}\]
Then we will find the value of only common number between \[A\] and \[B\] i.e. \[A \cap B\]. Therefore, we get
\[A \cap B = \left\{ {1,4,7,8} \right\} \cap \left\{ {4,8,6,9} \right\} = \left\{ {4,8} \right\}\]
Now we will find the value of \[A\Delta B\] which is the set of numbers which occur only in one particular set. Therefore, by subtracting \[A \cap B\] from \[A \cup B\] to get the value of \[A\Delta B\], we get
\[A\Delta B = A \cup B - A \cap B = \left\{ {1,4,7,6,8,9} \right\} - \left\{ {4,8} \right\} = \left\{ {1,7,6,9} \right\}\]
Hence the value of \[A\Delta B\] is \[\left\{ {1,7,6,9} \right\}\]
Now we will draw the Venn diagram of the given sets. Therefore, we get
Note:
Venn diagram is the diagram which shows all the possible relations between different sets of data. Venn diagrams are also termed as the primary diagram or logic diagram or set diagram. The area intersected by two circles is the area for the elements which are common in those two groups or sets. We should draw the Venn diagram carefully and keep in mind that in the common region the data may not repeat. The set which includes all the elements from every set of data is denoted as \[A \cup B\]. The set which includes only common terms between the given sets is generally denoted as \[A \cap B\]. Venn diagrams are generally used for showing some relation between different things or different groups of things or items.
Recently Updated Pages
Master Class 11 Economics: Engaging Questions & Answers for Success
Master Class 11 English: Engaging Questions & Answers for Success
Master Class 11 Maths: Engaging Questions & Answers for Success
Class 11 Question and Answer - Your Ultimate Solutions Guide
Master Class 11 Social Science: Engaging Questions & Answers for Success
Master Class 11 Business Studies: Engaging Questions & Answers for Success
Trending doubts
Differentiate between an exothermic and an endothermic class 11 chemistry CBSE
One Metric ton is equal to kg A 10000 B 1000 C 100 class 11 physics CBSE
There are 720 permutations of the digits 1 2 3 4 5 class 11 maths CBSE
In what year Guru Nanak Dev ji was born A15 April 1469 class 11 social science CBSE
Difference Between Prokaryotic Cells and Eukaryotic Cells
Draw a diagram of a plant cell and label at least eight class 11 biology CBSE