


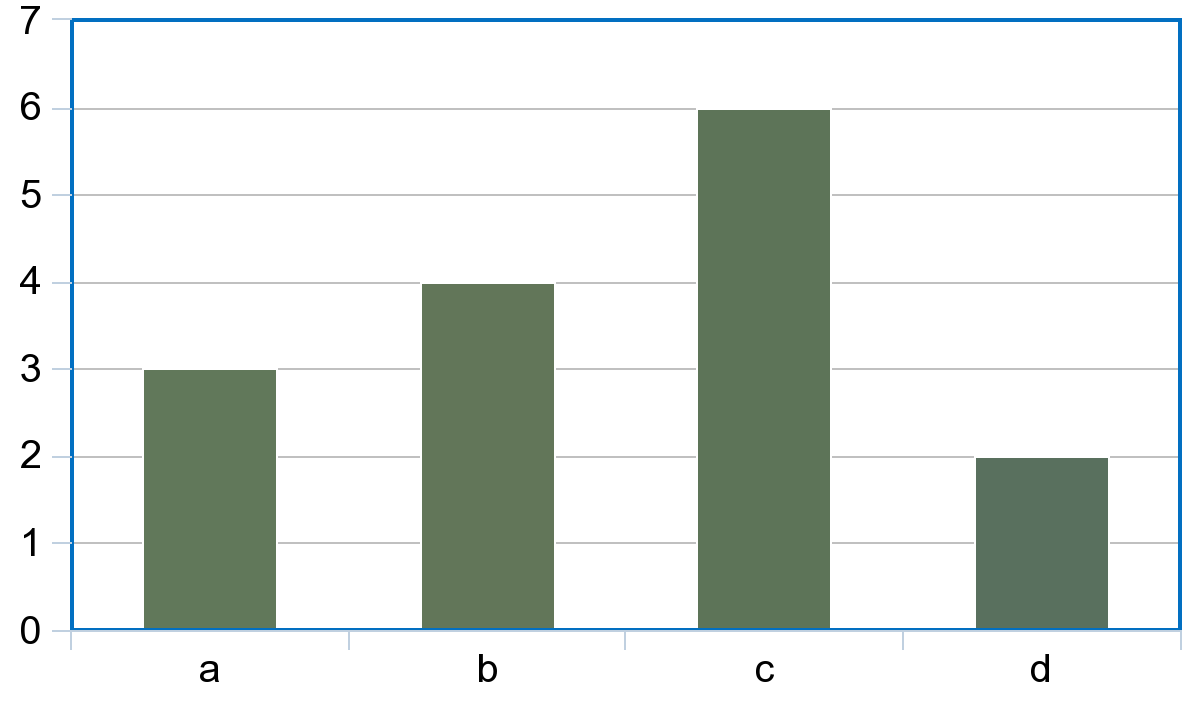
Examine the graph and determine which of the following is true.
(a) $c-b=b-d$
(b) $a+d=c$
(c) $c-d=a$
(d) $a+b=c+d$
Answer
550.5k+ views
Hint: We have to find the values of a, b, c and d from the given bar graph, by reading the values in the y-axis that correspond to the length of the bars of each element in the x-axis. Then, we have to verify each of the given options.
Complete step by step answer:
We are given a bar graph. Let us recollect how information is read from a bar graph. We know that a bar graph is a graph that presents categorical data with rectangular bars with heights or lengths proportional to the values that they represent. From the given bar graph, we can see that
$\begin{align}
& a=3 \\
& b=4 \\
& c=6 \\
& d=2 \\
\end{align}$
We have to check whether the given options are true or not. Let us check option (a).
Let us find the value of the LHS.
$\begin{align}
& \Rightarrow \text{LHS}=c-b=6-4 \\
& \Rightarrow c-b=2...\left( i \right) \\
\end{align}$
Now, we have found the value of RHS.
$\begin{align}
& \Rightarrow \text{RHS}=b-d=4-2 \\
& \Rightarrow b-d=2...\left( ii \right) \\
\end{align}$
From (i) and (ii), we can conclude that $\text{LHS}=\text{RHS}$ . Therefore, option a is true.
Now, let us check option b. We have to find the value of the LHS.
$\begin{align}
& \Rightarrow \text{LHS}=a+d=3+2 \\
& \Rightarrow a+d=5\ne c \\
\end{align}$
Therefore, option b is false.
Let us verify option c. We have to find the value of the LHS.
$\begin{align}
& \Rightarrow \text{LHS}=c-d=6-2 \\
& \Rightarrow c-d=4\ne a \\
\end{align}$
Therefore, option c is false.
Now, let us verify option d. We have to find the value of the LHS.
$\begin{align}
& \Rightarrow \text{LHS}=a+b=3+4 \\
& \Rightarrow a+b=7...\left( iii \right) \\
\end{align}$
Now, we have found the value of RHS.
$\begin{align}
& \Rightarrow \text{RHS}=c+d=6+2 \\
& \Rightarrow c+d=8...\left( iv \right) \\
\end{align}$
From (iii) and (iv), we can conclude that $\text{LHS}\ne \text{RHS}$ . Therefore, option d is false.
So, the correct answer is “Option a”.
Note: Students must read the bar graph and find the corresponding values of the elements in the x-axis carefully as there is a high chance of making mistakes in this step which will make the entire solution wrong. They must know to read the information from the bar graph. We also call bar graphs as bar charts.
Recently Updated Pages
Master Class 11 English: Engaging Questions & Answers for Success
Master Class 11 Social Science: Engaging Questions & Answers for Success
Master Class 11 Maths: Engaging Questions & Answers for Success
Master Class 11 Biology: Engaging Questions & Answers for Success
Master Class 11 Physics: Engaging Questions & Answers for Success
Master Class 11 Chemistry: Engaging Questions & Answers for Success
Trending doubts