


Draw the graph of the equation given below \[x + y = 2\]
Answer
478.5k+ views
Hint: First, identify the given equation. Then rearrange the given equation with our convenience. Assume some \[x\] values to find the \[y\] values on the given equation. We get some points with the given equation. And mention that points value in tabular format. Labeled the points in a graph. And draw a straight line. Now we get the straight line graph on a given equation.
Complete answer:
Given equation is \[x + y = 2\]
First, we rearrange the linear equation \[x + y = 2\]
We change the equation in right-hand side
We change the equation in right-hand side \[y\] terms and left-hand side in \[x\] terms, constant terms only.
So add \[ - x\] term on both sides of the linear equation
\[x + y - x = 2 - x\]
Subtract the terms on both sides of the linear equation,
\[y = 2 - x\]
Now we get the equation is \[y = 2 - x\] .
Assume that,
\[x = - 3\]apply the \[x\] value in the equation \[y\] Then,
\[y = 2 - ( - 3)\]
\[ = 2 + 3\]
\[ = 5\]
\[x = - 2\] apply the \[x\] value in the equation \[y\] Then,
\[y = 2 - ( - 2)\]
\[ = 2 + 2\]
\[ = 4\]
\[x = - 1\]apply the \[x\] value in the equation \[y\] Then,
\[y = 2 - ( - 1)\]
\[ = 2 + 1\]
\[ = 3\]
\[x = 0\]apply the \[x\] value in the equation \[y\] Then,
\[y = 2 - (0)\]
\[ = 2\]
\[x = 1\]apply the \[x\] value in the equation \[y\] Then,
\[y = 2 - 1\]
\[ = 1\]
\[x = 2\]apply the \[x\] value in the equation \[y\] Then,
\[y = 2 - 2\]
\[ = 0\]
\[x = 3\]apply the \[x\] value in the equation \[y\] Then,
\[y = 2 - 3\]
\[ = - 1\]
Now we mention the values in tabular format,
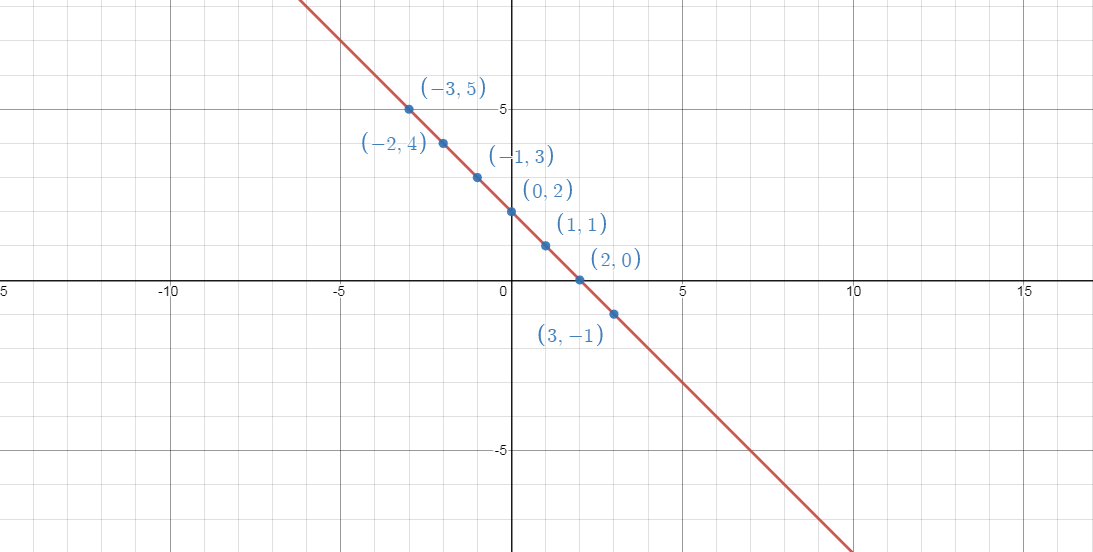
The Points are, \[( - 3,5),( - 2,4),( - 1,3),(0,2),(1,1),(2,0),(3, - 1)\]
Point out the points in the graph and join all points in a single line.
Draw the straight line.
Then we get a graph of \[x + y = 2\]
So that given equation is a straight line graph.
Note: We assume the \[x\] values to find the \[y\] values. Give the first preference to find the \[x\] values in \[ - 4 \leqslant x \leqslant 4\]these intervals. Because \[x \in [ - 4,4]\]in this interval we get the points are easily and simply. Draw a graph correctly labeled the points. Little change to the points labeled that are mis-matched in the graph.
Complete answer:
Given equation is \[x + y = 2\]
First, we rearrange the linear equation \[x + y = 2\]
We change the equation in right-hand side
We change the equation in right-hand side \[y\] terms and left-hand side in \[x\] terms, constant terms only.
So add \[ - x\] term on both sides of the linear equation
\[x + y - x = 2 - x\]
Subtract the terms on both sides of the linear equation,
\[y = 2 - x\]
Now we get the equation is \[y = 2 - x\] .
Assume that,
\[x = - 3\]apply the \[x\] value in the equation \[y\] Then,
\[y = 2 - ( - 3)\]
\[ = 2 + 3\]
\[ = 5\]
\[x = - 2\] apply the \[x\] value in the equation \[y\] Then,
\[y = 2 - ( - 2)\]
\[ = 2 + 2\]
\[ = 4\]
\[x = - 1\]apply the \[x\] value in the equation \[y\] Then,
\[y = 2 - ( - 1)\]
\[ = 2 + 1\]
\[ = 3\]
\[x = 0\]apply the \[x\] value in the equation \[y\] Then,
\[y = 2 - (0)\]
\[ = 2\]
\[x = 1\]apply the \[x\] value in the equation \[y\] Then,
\[y = 2 - 1\]
\[ = 1\]
\[x = 2\]apply the \[x\] value in the equation \[y\] Then,
\[y = 2 - 2\]
\[ = 0\]
\[x = 3\]apply the \[x\] value in the equation \[y\] Then,
\[y = 2 - 3\]
\[ = - 1\]
Now we mention the values in tabular format,
| \[x\] | \[ - 3\] | \[ - 2\] | \[ - 1\] | \[0\] | \[1\] | \[2\] | \[3\] |
| \[y\] | \[5\] | \[4\] | \[3\] | \[2\] | \[1\] | \[0\] | \[ - 1\] |
The Points are, \[( - 3,5),( - 2,4),( - 1,3),(0,2),(1,1),(2,0),(3, - 1)\]
Point out the points in the graph and join all points in a single line.
Draw the straight line.
Then we get a graph of \[x + y = 2\]
So that given equation is a straight line graph.
Note: We assume the \[x\] values to find the \[y\] values. Give the first preference to find the \[x\] values in \[ - 4 \leqslant x \leqslant 4\]these intervals. Because \[x \in [ - 4,4]\]in this interval we get the points are easily and simply. Draw a graph correctly labeled the points. Little change to the points labeled that are mis-matched in the graph.

Recently Updated Pages
Complete reduction of benzene diazonium chloride with class 12 chemistry CBSE
How can you identify optical isomers class 12 chemistry CBSE
The coating formed on the metals such as iron silver class 12 chemistry CBSE
Metals are refined by using different methods Which class 12 chemistry CBSE
What do you understand by denaturation of proteins class 12 chemistry CBSE
Assertion Nitrobenzene is used as a solvent in FriedelCrafts class 12 chemistry CBSE
Trending doubts
Difference Between Plant Cell and Animal Cell
Fill the blanks with the suitable prepositions 1 The class 9 english CBSE
Which places in India experience sunrise first and class 9 social science CBSE
What is pollution? How many types of pollution? Define it
Name 10 Living and Non living things class 9 biology CBSE
What is the full form of pH?