


Draw the energy level diagram for the line spectra representing Lyman Series and Balmer series in the spectrum of Hydrogen atoms.
Answer
622.8k+ views
Hint: When an electron makes a transition from one orbit to the other in an atom, it gains or loses energy due to which it emits wavelengths corresponding to the energy differences. These wavelengths are observed as lines called spectral lines. Different wavelengths are emitted for different transitions.
Formulas Used:
\[\dfrac{1}{\lambda }={{R}_{H}}(\dfrac{1}{{{n}_{1}}^{2}}-\dfrac{1}{{{n}_{2}}^{2}})\]
Complete answer:
In a hydrogen atom, when an electron moves from one orbit to the other, it emits rays of different wavelengths. The array of different wavelengths emitted is called the emission spectrum of hydrogen. These emissions are divided into a number of spectral series with wavelengths given by the Rydberg Formula. These series are observed as lines when electrons make transitions from one energy level to the other.
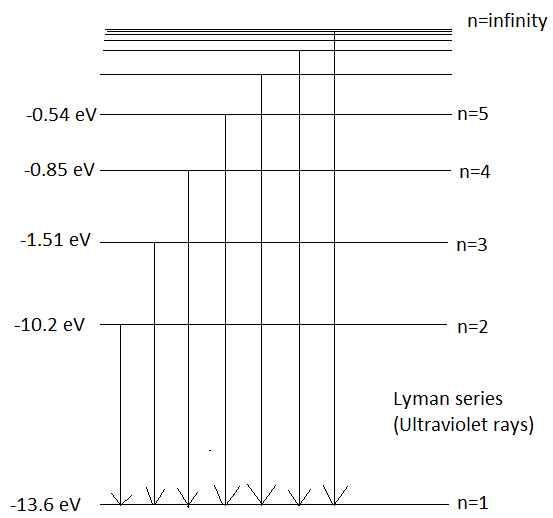
When an electron makes a transition to orbit, \[n=1\] from higher energy levels then the series of emission lines observed is called Lyman Series. It emits wavelengths in the ultraviolet region. Its wavelength can be given by Rydberg’s Formula which is,
\[\dfrac{1}{\lambda }={{R}_{H}}(\dfrac{1}{{{n}_{1}}^{2}}-\dfrac{1}{{{n}_{2}}^{2}})\] - (1)
Here, \[\lambda \] is the wavelength emitted
\[{{R}_{H}}\] is the Rydberg’s constant, its value is \[1.09\times {{10}^{7}}{{m}^{-1}}\]
Substituting the values of \[{{n}_{1}}=1\,and\,{{n}_{2}}=2\] in eq (1) we get,
\[\begin{align}
& \dfrac{1}{\lambda }=1.09\times {{10}^{7}}(1-\dfrac{1}{{{n}_{2}}^{2}}) \\
& here,\,{{n}_{2}}>1 \\
\end{align}\]
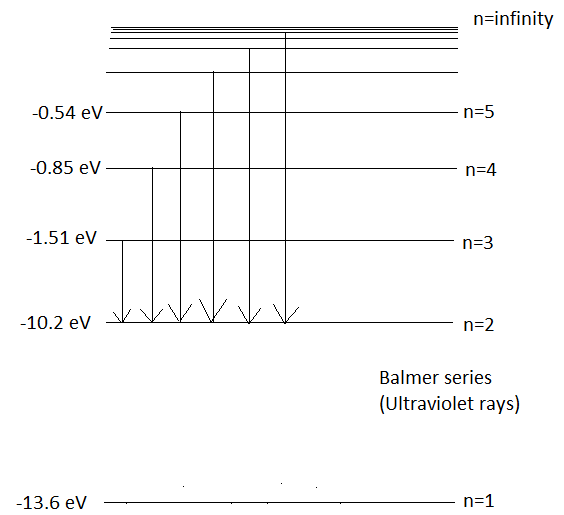
When an electron makes a transition to orbit, \[n=2\] from the higher orbits, then the series of spectral lines observed is called the Balmer series. It emits lines of wavelength in the ultraviolet region. Wavelengths in Balmer Series as calculated by Rydberg’s formula is-
\[\dfrac{1}{\lambda }={{R}_{H}}(\dfrac{1}{4}-\dfrac{1}{{{n}_{2}}^{2}})\]
Note:
In Bohr’s model of an atom, the orbits or energy levels are represented by principal quantum numbers (\[n=1,\,2,\,3,\,4,\,5,\,.....\]). Energy levels with only specific energy values can exist in Bohr’s model. At infinity, the energy of an electron becomes zero as the nuclear force acting on it is negligible.
Formulas Used:
\[\dfrac{1}{\lambda }={{R}_{H}}(\dfrac{1}{{{n}_{1}}^{2}}-\dfrac{1}{{{n}_{2}}^{2}})\]
Complete answer:
In a hydrogen atom, when an electron moves from one orbit to the other, it emits rays of different wavelengths. The array of different wavelengths emitted is called the emission spectrum of hydrogen. These emissions are divided into a number of spectral series with wavelengths given by the Rydberg Formula. These series are observed as lines when electrons make transitions from one energy level to the other.
When an electron makes a transition to orbit, \[n=1\] from higher energy levels then the series of emission lines observed is called Lyman Series. It emits wavelengths in the ultraviolet region. Its wavelength can be given by Rydberg’s Formula which is,
\[\dfrac{1}{\lambda }={{R}_{H}}(\dfrac{1}{{{n}_{1}}^{2}}-\dfrac{1}{{{n}_{2}}^{2}})\] - (1)
Here, \[\lambda \] is the wavelength emitted
\[{{R}_{H}}\] is the Rydberg’s constant, its value is \[1.09\times {{10}^{7}}{{m}^{-1}}\]
Substituting the values of \[{{n}_{1}}=1\,and\,{{n}_{2}}=2\] in eq (1) we get,
\[\begin{align}
& \dfrac{1}{\lambda }=1.09\times {{10}^{7}}(1-\dfrac{1}{{{n}_{2}}^{2}}) \\
& here,\,{{n}_{2}}>1 \\
\end{align}\]
When an electron makes a transition to orbit, \[n=2\] from the higher orbits, then the series of spectral lines observed is called the Balmer series. It emits lines of wavelength in the ultraviolet region. Wavelengths in Balmer Series as calculated by Rydberg’s formula is-
\[\dfrac{1}{\lambda }={{R}_{H}}(\dfrac{1}{4}-\dfrac{1}{{{n}_{2}}^{2}})\]
Note:
In Bohr’s model of an atom, the orbits or energy levels are represented by principal quantum numbers (\[n=1,\,2,\,3,\,4,\,5,\,.....\]). Energy levels with only specific energy values can exist in Bohr’s model. At infinity, the energy of an electron becomes zero as the nuclear force acting on it is negligible.
Recently Updated Pages
Basicity of sulphurous acid and sulphuric acid are
Master Class 12 Economics: Engaging Questions & Answers for Success
Master Class 12 Biology: Engaging Questions & Answers for Success
Master Class 11 English: Engaging Questions & Answers for Success
Master Class 11 Physics: Engaging Questions & Answers for Success
Master Class 11 Computer Science: Engaging Questions & Answers for Success
Trending doubts
Draw a labelled sketch of the human eye class 12 physics CBSE
The chemical formula of tear gas is A CO Cl 2 B C 10 class 12 chemistry CBSE
Draw ray diagrams each showing i myopic eye and ii class 12 physics CBSE
Which are the Top 10 Largest Countries of the World?
Differentiate between homogeneous and heterogeneous class 12 chemistry CBSE
Which is the correct genotypic ratio of mendel dihybrid class 12 biology CBSE