


How can I draw activation energy in a diagram?
Answer
573.6k+ views
Hint: The energy changes that occur during a chemical reaction can be shown in a diagram called a potential energy diagram, or sometimes called a reaction progress curve.
The activation energy is depicted by potential energy.
A potential energy diagram shows the change in potential energy of a system as reactants are converted into products.. The total potential energy of the system increases for the endothermic reaction as the system absorbs energy from the surroundings. The total potential energy of the system decreases for the exothermic reaction as the system releases energy to the surroundings.
Complete step by step answer:
The activation energy for a reaction is illustrated in the potential energy diagram by the height of the hill between the reactants and the products.
For this reason, the activation energy of a reaction is sometimes referred to as the activation energy barrier. Reacting particles must have enough energy so that when they collide they can overcome that barrier
Draw and label a pair of axes.

Label the vertical axis "Potential Energy" and the horizontal axis "Reaction Coordinate".
Draw and label two short horizontal lines to mark the energies of the reactants and products.
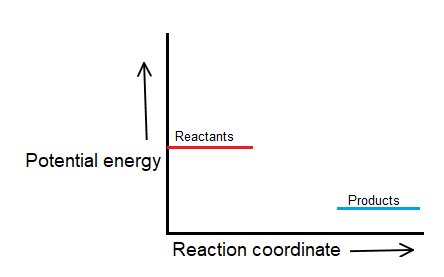
There must be a hump in the curve to represent the energy level of the activated complex.

Draw and label the activation energy.
Draw a horizontal line from the highest part of the curve towards the vertical axis.

The activation energy \[{{\text{E}}_{\text{a}}}\] is the difference between the energy of the activated complex and that of the reactants.
\[{{\text{E}}_{\text{a}}}=\]$E_activated \;complex–E_reactants$
Note: Activation energy concepts help us to understand the chemical kinetics of a reaction as well as it helps us to know the energy involved during the reaction.
The activation energy is depicted by potential energy.
A potential energy diagram shows the change in potential energy of a system as reactants are converted into products.. The total potential energy of the system increases for the endothermic reaction as the system absorbs energy from the surroundings. The total potential energy of the system decreases for the exothermic reaction as the system releases energy to the surroundings.
Complete step by step answer:
The activation energy for a reaction is illustrated in the potential energy diagram by the height of the hill between the reactants and the products.
For this reason, the activation energy of a reaction is sometimes referred to as the activation energy barrier. Reacting particles must have enough energy so that when they collide they can overcome that barrier
Draw and label a pair of axes.
Label the vertical axis "Potential Energy" and the horizontal axis "Reaction Coordinate".
Draw and label two short horizontal lines to mark the energies of the reactants and products.
There must be a hump in the curve to represent the energy level of the activated complex.
Draw and label the activation energy.
Draw a horizontal line from the highest part of the curve towards the vertical axis.
The activation energy \[{{\text{E}}_{\text{a}}}\] is the difference between the energy of the activated complex and that of the reactants.
\[{{\text{E}}_{\text{a}}}=\]$E_activated \;complex–E_reactants$
Note: Activation energy concepts help us to understand the chemical kinetics of a reaction as well as it helps us to know the energy involved during the reaction.
Recently Updated Pages
Master Class 12 Business Studies: Engaging Questions & Answers for Success
Master Class 12 Biology: Engaging Questions & Answers for Success
Master Class 12 Chemistry: Engaging Questions & Answers for Success
Class 12 Question and Answer - Your Ultimate Solutions Guide
Master Class 11 Social Science: Engaging Questions & Answers for Success
Master Class 11 English: Engaging Questions & Answers for Success
Trending doubts
Which is more stable and why class 12 chemistry CBSE
Which are the Top 10 Largest Countries of the World?
Draw a labelled sketch of the human eye class 12 physics CBSE
Differentiate between homogeneous and heterogeneous class 12 chemistry CBSE
What are the major means of transport Explain each class 12 social science CBSE
Sulphuric acid is known as the king of acids State class 12 chemistry CBSE