


Draw a cumulative frequency curve for the following distribution by less than ogive method.
Age 0 – 9 10 – 19 20 – 29 30 – 39 40 – 49 50 – 59 60 – 69 No. of Lessons 5 15 20 23 17 11 9
| Age | 0 – 9 | 10 – 19 | 20 – 29 | 30 – 39 | 40 – 49 | 50 – 59 | 60 – 69 |
| No. of Lessons | 5 | 15 | 20 | 23 | 17 | 11 | 9 |
Answer
600k+ views
Hint:
Here, first we will convert the given inclusive series into an exclusive series. Then, we will convert the exclusive series into a less than type series using cumulative frequencies. Using the less than type series, and taking the age on \[x\]-axis and number of lessons on \[y\]-axis, we will plot the points and join them to get the required cumulative frequency curve/ogive.
Complete step by step solution:
The given table shows an inclusive series.
Here, we cannot say that the class size of the interval 10 – 19 is 9, because this is an inclusive series.
We will now convert this series to an exclusive series.
Here, the upper limit of the class interval 10 – 19 is 19. The lower limit of the next class interval is 20.
The difference between the upper limit of 10 – 19 and lower limit of the next class is 1.
We will subtract half of this difference from the lower limit of 10 – 19, and add half of this difference to the upper limit of 10 – 19.
Thus, the new class interval becomes \[9.5 - 19.5\].
Similarly, we will change the rest of the class intervals to convert the series into an exclusive series.
Therefore, the inclusive series becomes the exclusive series as shown below.
The first class interval starts from a negative number.
However, since age cannot be negative, the frequency polygon will remain within the positive axes.
Now, we will create a less than ogive table, using cumulative frequencies.
For example, “Less than \[19.5\]” will include frequencies of both the class intervals \[\left( { - 0.5} \right) - 9.5\] and \[9.5 - 19.5\].
Similarly, we will convert the rest of the class intervals into less than type.
Finally, we will use the age on \[x\]-axis and number of lessons on \[y\]-axis to draw the less than ogive.
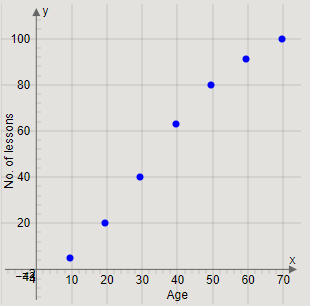
Plotting the points \[\left( {9.5,5} \right),\left( {19.5,20} \right),\left( {29.5,40} \right),\left( {39.5,63} \right),\left( {49.5,80} \right),\left( {59.5,91} \right),\left( {69.5,100} \right)\], we get the graph
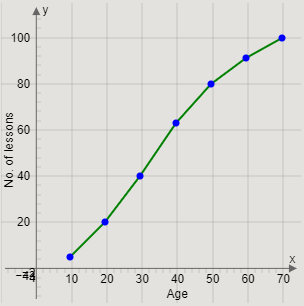
Joining the pairs of two successive points, we get the curve
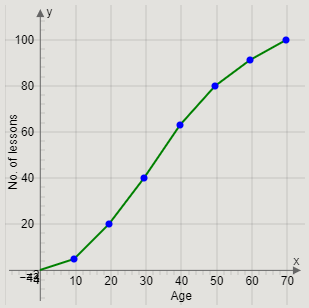
Finally, we will join the first point to the origin to complete the frequency curve.
Therefore, we get the required frequency curve as
Note:
We have used the terms ‘exclusive series’ and ‘inclusive series’ in the solution.
An inclusive series is that series where the class intervals include both upper and lower limits. For example: In the given inclusive series, 10 – 19 includes all the numbers between 10 and 19, including 10 and 19 also.
An exclusive series is that series where the class intervals include both upper and lower limits. We know that in an exclusive series, the upper limit of a class interval is equal to the lower limit of the next class interval. For example: In the exclusive series, \[9.5\] – \[19.5\] includes all the numbers between \[9.5\] and \[19.5\], including \[9.5\] but not \[19.5\].
It is important to convert an inclusive series into an exclusive series before making the less than or more than series.
Here, first we will convert the given inclusive series into an exclusive series. Then, we will convert the exclusive series into a less than type series using cumulative frequencies. Using the less than type series, and taking the age on \[x\]-axis and number of lessons on \[y\]-axis, we will plot the points and join them to get the required cumulative frequency curve/ogive.
Complete step by step solution:
The given table shows an inclusive series.
Here, we cannot say that the class size of the interval 10 – 19 is 9, because this is an inclusive series.
We will now convert this series to an exclusive series.
Here, the upper limit of the class interval 10 – 19 is 19. The lower limit of the next class interval is 20.
The difference between the upper limit of 10 – 19 and lower limit of the next class is 1.
We will subtract half of this difference from the lower limit of 10 – 19, and add half of this difference to the upper limit of 10 – 19.
Thus, the new class interval becomes \[9.5 - 19.5\].
Similarly, we will change the rest of the class intervals to convert the series into an exclusive series.
Therefore, the inclusive series becomes the exclusive series as shown below.
| Age | \[\left( { - 0.5} \right) - 9.5\] | \[9.5 - 19.5\] | \[19.5 - 29.5\] | \[29.5 - 39.5\] | \[39.5 - 49.5\] | \[49.5 - 59.5\] | \[59.5 - 69.5\] |
| No. of Lessons | 5 | 15 | 20 | 23 | 17 | 11 | 9 |
The first class interval starts from a negative number.
However, since age cannot be negative, the frequency polygon will remain within the positive axes.
Now, we will create a less than ogive table, using cumulative frequencies.
For example, “Less than \[19.5\]” will include frequencies of both the class intervals \[\left( { - 0.5} \right) - 9.5\] and \[9.5 - 19.5\].
Similarly, we will convert the rest of the class intervals into less than type.
| Age | Less than \[9.5\] | Less than \[19.5\] | Less than \[29.5\] | Less than \[39.5\] | Less than \[49.5\] | Less than \[59.5\] | Less than \[69.5\] |
| No. of Lessons | 5 | 20 | 40 | 63 | 80 | 91 | 100 |
Finally, we will use the age on \[x\]-axis and number of lessons on \[y\]-axis to draw the less than ogive.
Plotting the points \[\left( {9.5,5} \right),\left( {19.5,20} \right),\left( {29.5,40} \right),\left( {39.5,63} \right),\left( {49.5,80} \right),\left( {59.5,91} \right),\left( {69.5,100} \right)\], we get the graph
Joining the pairs of two successive points, we get the curve
Finally, we will join the first point to the origin to complete the frequency curve.
Therefore, we get the required frequency curve as
Note:
We have used the terms ‘exclusive series’ and ‘inclusive series’ in the solution.
An inclusive series is that series where the class intervals include both upper and lower limits. For example: In the given inclusive series, 10 – 19 includes all the numbers between 10 and 19, including 10 and 19 also.
An exclusive series is that series where the class intervals include both upper and lower limits. We know that in an exclusive series, the upper limit of a class interval is equal to the lower limit of the next class interval. For example: In the exclusive series, \[9.5\] – \[19.5\] includes all the numbers between \[9.5\] and \[19.5\], including \[9.5\] but not \[19.5\].
It is important to convert an inclusive series into an exclusive series before making the less than or more than series.
Recently Updated Pages
Master Class 12 Business Studies: Engaging Questions & Answers for Success
Master Class 12 Chemistry: Engaging Questions & Answers for Success
Master Class 12 Biology: Engaging Questions & Answers for Success
Class 12 Question and Answer - Your Ultimate Solutions Guide
Master Class 11 Social Science: Engaging Questions & Answers for Success
Master Class 11 English: Engaging Questions & Answers for Success
Trending doubts
Which is more stable and why class 12 chemistry CBSE
Which are the Top 10 Largest Countries of the World?
Draw a labelled sketch of the human eye class 12 physics CBSE
Differentiate between homogeneous and heterogeneous class 12 chemistry CBSE
What are the major means of transport Explain each class 12 social science CBSE
Sulphuric acid is known as the king of acids State class 12 chemistry CBSE