


What does the box in a box-plot represent?
Answer
557.7k+ views
Hint: To answer our question we will first understand what does a box and whisker plot represent. Sometimes, we need more details in the distribution of data-sets that may not be fulfilled by the measure of central tendency like the mean, median and the mode. This demand can be fulfilled by a box and whiskers plot. A Box plot is a graph that provides us with much firm indication about how the values in the data should be spread.
Complete step by step solution:
Let us first see how a Box and Whisker plot, often called a Boxplot is represented:
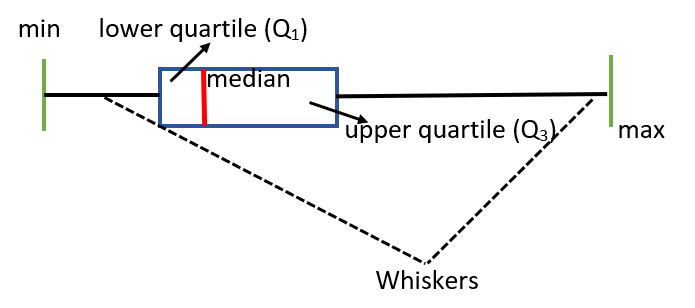
There are six elements in the Box and Whiskers plot. These are, the minimum score, the maximum score, the median, the lower quartile, the upper quartile and the whiskers.
Now, the percentage of data represented by each part of a box and whisker plot is given as follows:
The part till minimum score gives us $0\%$ data.
The part till the first whisker gives us $25\%$ data.
The Median (covering the interquartile region) gives us $50\%$ of data.
The part till the second whisker gives us $75\%$ of data. And, at last
The part till the maximum gives us $100\%$ of data.
From our above observation, we can conclude that the “Box (that is, the complete interquartile region)” represents the middle or center $50\%$ of the population.
Practically, that means $25\%$ will have a value lower than the “Box” and $25\%$ will have a value higher than the “Box”.
Hence, we can say that the “Box” in a Box-plot represents $50\%$ of the central data.
Note:
The Box plot offers us a visual summary of the data, therefore allowing the researchers to identify the mean values, the dispersion of the set and the signs of skewness. A Box plot offers to display the outliers within the data set. It also helps us get more knowledge about the symmetry of the data, that is, when the median is in the middle, and the whiskers on both sides are equal, the distribution will be symmetric.
Complete step by step solution:
Let us first see how a Box and Whisker plot, often called a Boxplot is represented:
There are six elements in the Box and Whiskers plot. These are, the minimum score, the maximum score, the median, the lower quartile, the upper quartile and the whiskers.
Now, the percentage of data represented by each part of a box and whisker plot is given as follows:
The part till minimum score gives us $0\%$ data.
The part till the first whisker gives us $25\%$ data.
The Median (covering the interquartile region) gives us $50\%$ of data.
The part till the second whisker gives us $75\%$ of data. And, at last
The part till the maximum gives us $100\%$ of data.
From our above observation, we can conclude that the “Box (that is, the complete interquartile region)” represents the middle or center $50\%$ of the population.
Practically, that means $25\%$ will have a value lower than the “Box” and $25\%$ will have a value higher than the “Box”.
Hence, we can say that the “Box” in a Box-plot represents $50\%$ of the central data.
Note:
The Box plot offers us a visual summary of the data, therefore allowing the researchers to identify the mean values, the dispersion of the set and the signs of skewness. A Box plot offers to display the outliers within the data set. It also helps us get more knowledge about the symmetry of the data, that is, when the median is in the middle, and the whiskers on both sides are equal, the distribution will be symmetric.
Recently Updated Pages
Master Class 12 Economics: Engaging Questions & Answers for Success
Master Class 12 English: Engaging Questions & Answers for Success
Master Class 12 Social Science: Engaging Questions & Answers for Success
Master Class 12 Maths: Engaging Questions & Answers for Success
Master Class 12 Physics: Engaging Questions & Answers for Success
Master Class 9 General Knowledge: Engaging Questions & Answers for Success
Trending doubts
Which are the Top 10 Largest Countries of the World?
Draw a labelled sketch of the human eye class 12 physics CBSE
Differentiate between homogeneous and heterogeneous class 12 chemistry CBSE
Why is the cell called the structural and functional class 12 biology CBSE
Draw ray diagrams each showing i myopic eye and ii class 12 physics CBSE
Which is the correct genotypic ratio of mendel dihybrid class 12 biology CBSE