


How does a motion graph of distance v/s time differ from a graph of speed v/s time?
Answer
582.6k+ views
Hint: The graph between two quantities tells us the relation between two quantities. A straight line means a direct relationship between quantities exists. In both the graphs, time is the independent quantity while distance and speed are dependent quantities.
Complete step-by-step solution:
A graph between two quantities gives us a pictorial relation between two quantities. The shape of the graph describes the relation. Usually, the dependent quantity is taken along the y-axis and the independent quantity is taken along the x-axis.
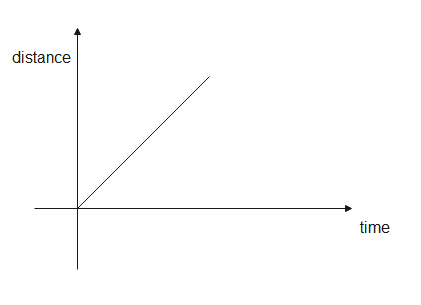
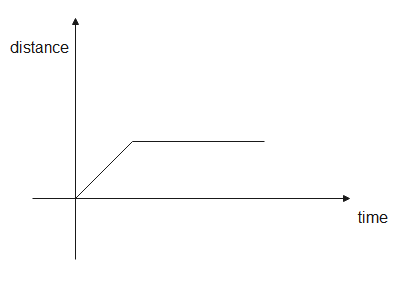
In a distance- time graph, the distance is taken along the y-axis while the time is taken along the x-axis. The graph tells us the distance travelled at a particular time. As time increases, the distance also increases so distance is directly proportional to time and hence, the graph is a straight line and its slope is positive or zero.
 .
.
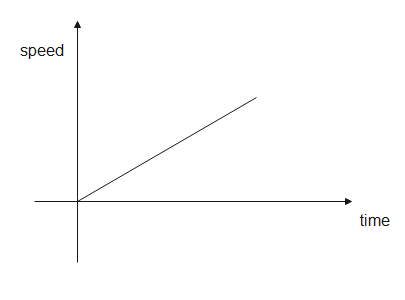
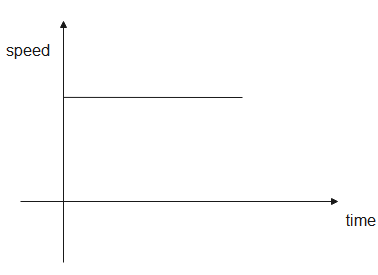
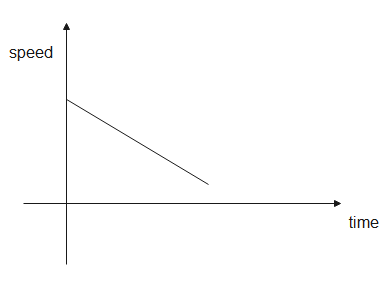
In a speed-time graph, the, the speed is taken along the y-axis while the time is taken along the x-axis. The graph shows us the speed of a body at a particular time. The graph between speed and time is a straight line but its slope can be positive, negative, zero or infinity depending on the motion of the body. The area covered under the graph gives us the distance.
Hence, the distance-time graph tells us the distance travelled at a certain time while the speed-time graph tells us the speed of a body at a certain time.
Note:
Distance and speed are scalar quantities. We can determine the direction of a body from the speed time graph. When a body is at rest or in uniform motion, the speed-time graph is parallel to the x-axis. If the speed of a body changes continuously, it is undergoing acceleration.
Complete step-by-step solution:
A graph between two quantities gives us a pictorial relation between two quantities. The shape of the graph describes the relation. Usually, the dependent quantity is taken along the y-axis and the independent quantity is taken along the x-axis.
In a distance- time graph, the distance is taken along the y-axis while the time is taken along the x-axis. The graph tells us the distance travelled at a particular time. As time increases, the distance also increases so distance is directly proportional to time and hence, the graph is a straight line and its slope is positive or zero.
In a speed-time graph, the, the speed is taken along the y-axis while the time is taken along the x-axis. The graph shows us the speed of a body at a particular time. The graph between speed and time is a straight line but its slope can be positive, negative, zero or infinity depending on the motion of the body. The area covered under the graph gives us the distance.
Hence, the distance-time graph tells us the distance travelled at a certain time while the speed-time graph tells us the speed of a body at a certain time.
Note:
Distance and speed are scalar quantities. We can determine the direction of a body from the speed time graph. When a body is at rest or in uniform motion, the speed-time graph is parallel to the x-axis. If the speed of a body changes continuously, it is undergoing acceleration.
Recently Updated Pages
Master Class 11 English: Engaging Questions & Answers for Success
Master Class 11 Maths: Engaging Questions & Answers for Success
Class 11 Question and Answer - Your Ultimate Solutions Guide
Master Class 11 Biology: Engaging Questions & Answers for Success
Master Class 11 Physics: Engaging Questions & Answers for Success
Master Class 11 Accountancy: Engaging Questions & Answers for Success
Trending doubts
Differentiate between an exothermic and an endothermic class 11 chemistry CBSE
One Metric ton is equal to kg A 10000 B 1000 C 100 class 11 physics CBSE
Difference Between Prokaryotic Cells and Eukaryotic Cells
There are 720 permutations of the digits 1 2 3 4 5 class 11 maths CBSE
Draw a diagram of a plant cell and label at least eight class 11 biology CBSE
1 Quintal is equal to a 110 kg b 10 kg c 100kg d 1000 class 11 physics CBSE