


Define the refractive index of a transparent medium, a ray of light passes through a triangular prism. Plot a graph showing the variation of the angle of deviation with the angle of incidence.
Answer
558.3k+ views
Hint: The ratio of the speed of light in air to speed of light in the medium is called the Refractive Index. While plotting the graph of the angle of deviation versus angle of incidence, the angle of deviation is taken on the Y-axis while the angle of incidence is taken on X-axis. The resultant graph should be a curved graph.
Complete step-by-step solution:
The Refractive index of a transparent medium is defined as the ratio of the speed of light in air i.e. vacuum to the speed of light in a medium. Basically, it measures the bending of light when it travels from one medium to another. It is also called the Index of Refraction.
It is given by the equation,
$\mu=\dfrac { c }{ v }$
where, $\mu$: Refractive index of the medium
c: Speed of light in vacuum
v: speed of light in a medium
Refractive Index is a unitless quantity. The Refractive index of glass is 1.5 while that of water is 1.33. As the refractive index of glass is greater than the refractive index of water, the speed of light in water is faster as compared to that in the glass. Thus, the higher the refractive index, the lower is the speed of light in that medium.
The higher the refractive index, the more the light can bend. Diamond has the refractive index which is 2.42. The Refractive index of air is 1.
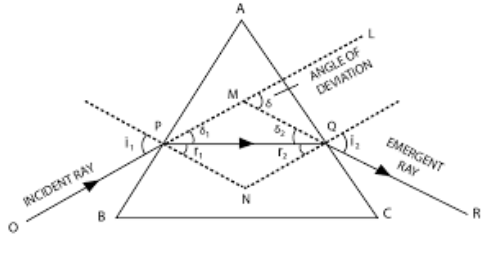
The expression for refractive index of the material of a triangular prism is given by,
$\mu =\dfrac { \sin { \left( \dfrac { A+{ \delta }_{ m } }{ 2 } \right) } }{ \sin { \left( \dfrac { A }{ 2 } \right) } }$
where, ${ \delta }_{ m }$: Angle of minimum deviation
A: Angle of prism
The graph showing variation in the angle of deviation with the angle of incidence is given below:
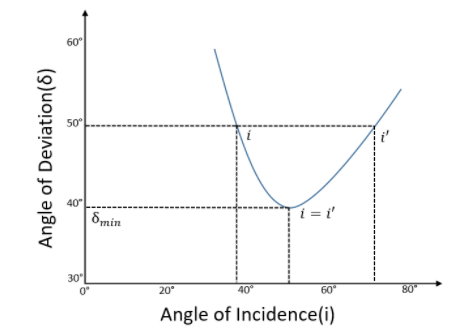
Note: It is mentioned in the question that plot the graph showing variation in the angle of deviation with the angle of incidence, Hence, the angle of incidence and angle of deviation are taken on X-axis and Y-axis respectively. If it was asked to show variation in the angle of incidence with a change in the angle of deviation then the axes would have exchanged.
Complete step-by-step solution:
The Refractive index of a transparent medium is defined as the ratio of the speed of light in air i.e. vacuum to the speed of light in a medium. Basically, it measures the bending of light when it travels from one medium to another. It is also called the Index of Refraction.
It is given by the equation,
$\mu=\dfrac { c }{ v }$
where, $\mu$: Refractive index of the medium
c: Speed of light in vacuum
v: speed of light in a medium
Refractive Index is a unitless quantity. The Refractive index of glass is 1.5 while that of water is 1.33. As the refractive index of glass is greater than the refractive index of water, the speed of light in water is faster as compared to that in the glass. Thus, the higher the refractive index, the lower is the speed of light in that medium.
The higher the refractive index, the more the light can bend. Diamond has the refractive index which is 2.42. The Refractive index of air is 1.
The expression for refractive index of the material of a triangular prism is given by,
$\mu =\dfrac { \sin { \left( \dfrac { A+{ \delta }_{ m } }{ 2 } \right) } }{ \sin { \left( \dfrac { A }{ 2 } \right) } }$
where, ${ \delta }_{ m }$: Angle of minimum deviation
A: Angle of prism
The graph showing variation in the angle of deviation with the angle of incidence is given below:
Note: It is mentioned in the question that plot the graph showing variation in the angle of deviation with the angle of incidence, Hence, the angle of incidence and angle of deviation are taken on X-axis and Y-axis respectively. If it was asked to show variation in the angle of incidence with a change in the angle of deviation then the axes would have exchanged.
Recently Updated Pages
Master Class 12 Business Studies: Engaging Questions & Answers for Success
Master Class 12 Biology: Engaging Questions & Answers for Success
Master Class 12 Chemistry: Engaging Questions & Answers for Success
Class 12 Question and Answer - Your Ultimate Solutions Guide
Master Class 11 English: Engaging Questions & Answers for Success
Master Class 11 Social Science: Engaging Questions & Answers for Success
Trending doubts
Which are the Top 10 Largest Countries of the World?
Draw a labelled sketch of the human eye class 12 physics CBSE
Differentiate between homogeneous and heterogeneous class 12 chemistry CBSE
Why is the cell called the structural and functional class 12 biology CBSE
Draw ray diagrams each showing i myopic eye and ii class 12 physics CBSE
Which is the correct genotypic ratio of mendel dihybrid class 12 biology CBSE