


Define modulus function. Draw the graph of the modulus function and write its domain and range.
Answer
656.7k+ views
Hint: Here, first we have to define about the function, domain and range and then we should explain about the modulus function which is $f(x)=\left| x \right|=\left\{ \begin{align}
& x,x\ge 0 \\
& -x,x<0 \\
\end{align} \right.$ $\forall x\in \mathbb{R}$. Now for different values of $x$ find $y=f(x)$ to plot the graph and from the graph will get the idea about the domain and range of the function $f(x)$.
Complete step-by-step answer:
To define a modulus function first we should know about a function. A relation $f$ from a set A to a set B is said to be a function if every element of A has one and only one image in set B.
That is, for the notation $f:X\to Y$ means that $f$ is a function from $X$ to $Y$. $X$ is called the domain of $f$ and $Y$ is called the codomain of $f$. The set of all values of $f(x)$ taken together is called the range of $f$.
Range of $f$= $\left\{ y\in Y|y=f(x),\text{ for some }x\text{ in }X \right\}$
There are some specific types of functions. One of such function is the modulus function.
Now, we can define the modulus function. The modulus function is the real function $f:\mathbb{R}\to \mathbb{R}$ defined by:
$f(x)=\left| x \right|=\left\{ \begin{align}
& x,x\ge 0 \\
& -x,x<0 \\
\end{align} \right.$ $\forall x\in \mathbb{R}$.
Now, let us check $f(x)$ for different values of $x$.
Consider, $x=-1$ we have, $x<0,f(x)=-x$, then
$\begin{align}
& y=f(-1) \\
& y=-(-1) \\
& y==1 \\
\end{align}$
Consider, $x=-2$ we have, $x<0,f(x)=-x$, then
$\begin{align}
& y=f(-2) \\
& y=-(-2) \\
& y=2 \\
\end{align}$
Now, for $x=0$, we have, $x\ge 0$, so $f(x)=x$. Hence, we will get:
$\begin{align}
& y=f(0) \\
& y=0 \\
\end{align}$.
Consider, $x=1$, we have, $x>0$, so $f(x)=x$. Hence, we will get:
$\begin{align}
& y=f(1) \\
& y=1 \\
\end{align}$.
Consider, $x=2$, we have, $x>0$, so $f(x)=x$. Hence, we will get:
$\begin{align}
& y=f(2) \\
& y=2 \\
\end{align}$.
Now, let us plot the graph of modulus function.
Consider, some points to plot the graph.
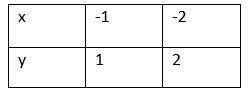
First, for $x<0$, we have $f(x)=-x$. Now, consider two points:$$
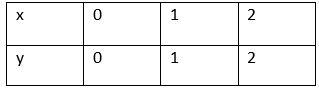
Now, consider for $x\ge 0$, we have $f(x)=x$. So, consider the points:
With these points we will get the graph as follows:
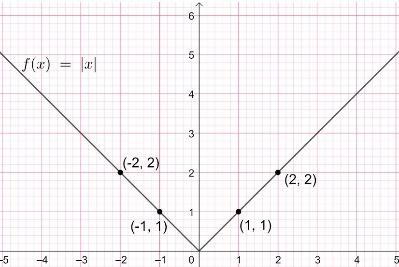
Now, from the graph, let us write the domain and range of the function $f(x)=|x|$.
Here, domain of $f$ = all values of real numbers, $\mathbb{R}$
Range of $f$ = all positive real numbers and zero.
Note: Here you have to split the function for $x<0$ and $x\ge 0$, to get a clear understanding. It is also helpful to plot the graph if you split the function, since the function is defined differently for both the cases.
& x,x\ge 0 \\
& -x,x<0 \\
\end{align} \right.$ $\forall x\in \mathbb{R}$. Now for different values of $x$ find $y=f(x)$ to plot the graph and from the graph will get the idea about the domain and range of the function $f(x)$.
Complete step-by-step answer:
To define a modulus function first we should know about a function. A relation $f$ from a set A to a set B is said to be a function if every element of A has one and only one image in set B.
That is, for the notation $f:X\to Y$ means that $f$ is a function from $X$ to $Y$. $X$ is called the domain of $f$ and $Y$ is called the codomain of $f$. The set of all values of $f(x)$ taken together is called the range of $f$.
Range of $f$= $\left\{ y\in Y|y=f(x),\text{ for some }x\text{ in }X \right\}$
There are some specific types of functions. One of such function is the modulus function.
Now, we can define the modulus function. The modulus function is the real function $f:\mathbb{R}\to \mathbb{R}$ defined by:
$f(x)=\left| x \right|=\left\{ \begin{align}
& x,x\ge 0 \\
& -x,x<0 \\
\end{align} \right.$ $\forall x\in \mathbb{R}$.
Now, let us check $f(x)$ for different values of $x$.
Consider, $x=-1$ we have, $x<0,f(x)=-x$, then
$\begin{align}
& y=f(-1) \\
& y=-(-1) \\
& y==1 \\
\end{align}$
Consider, $x=-2$ we have, $x<0,f(x)=-x$, then
$\begin{align}
& y=f(-2) \\
& y=-(-2) \\
& y=2 \\
\end{align}$
Now, for $x=0$, we have, $x\ge 0$, so $f(x)=x$. Hence, we will get:
$\begin{align}
& y=f(0) \\
& y=0 \\
\end{align}$.
Consider, $x=1$, we have, $x>0$, so $f(x)=x$. Hence, we will get:
$\begin{align}
& y=f(1) \\
& y=1 \\
\end{align}$.
Consider, $x=2$, we have, $x>0$, so $f(x)=x$. Hence, we will get:
$\begin{align}
& y=f(2) \\
& y=2 \\
\end{align}$.
Now, let us plot the graph of modulus function.
Consider, some points to plot the graph.
First, for $x<0$, we have $f(x)=-x$. Now, consider two points:$$
Now, consider for $x\ge 0$, we have $f(x)=x$. So, consider the points:
With these points we will get the graph as follows:
Now, from the graph, let us write the domain and range of the function $f(x)=|x|$.
Here, domain of $f$ = all values of real numbers, $\mathbb{R}$
Range of $f$ = all positive real numbers and zero.
Note: Here you have to split the function for $x<0$ and $x\ge 0$, to get a clear understanding. It is also helpful to plot the graph if you split the function, since the function is defined differently for both the cases.
Recently Updated Pages
Master Class 12 Economics: Engaging Questions & Answers for Success
Master Class 12 Biology: Engaging Questions & Answers for Success
Master Class 11 English: Engaging Questions & Answers for Success
Master Class 11 Physics: Engaging Questions & Answers for Success
Master Class 11 Computer Science: Engaging Questions & Answers for Success
Master Class 11 Chemistry: Engaging Questions & Answers for Success
Trending doubts
What is the Total Duration of Football Match?
Explain the Treaty of Vienna of 1815 class 10 social science CBSE
In football, which nation is called "La Roja"?
Why is there a time difference of about 5 hours between class 10 social science CBSE
10 examples of evaporation in daily life with explanations
What is the full form of POSCO class 10 social science CBSE