


Can there be a time-temperature graph as follows? Justify your answer.
Answer
630.6k+ views
Hint: Here what we need to do is to study the given graphs and identify the valid and invalid ones. Comparing the change of time and corresponding changes in temperature, we will arrive at a conclusion.
Formula used:
In a time-temperature graph (generally speaking $x - y$ graph), the x-axis represents time and the y-axis represents temperature. The graph represents the variation of temperature with respect to time.
Complete step by step answer:
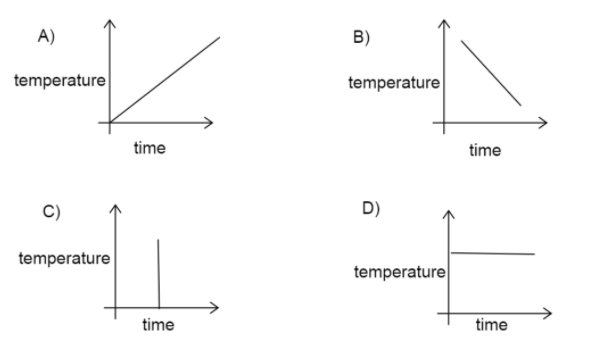
Here we have four cases of time and temperature variation.
Let us study each one separately.
A) Here, the temperature is increasing as time increases. It is a valid case.
B) Here, the temperature is decreasing as time increases, which is also a valid case.
C) In this case, the temperature is increasing in constant time. This case is invalid since the different temperature is not possible at a time.
D) In this case, the temperature remains constant as time increases, which is also possible.
Therefore, the possible cases are A, B, and D.
Additional information:
Graphs are basically used to express the collected or observed information in a way that is easier to understand and compare. It is used in different fields at times. The slope of the graph represents the derivative of the function in the y-axis with respect to the function in the x-axis.
Note:
We must be careful in understanding from the graph what is constant and what is varying. Here in cases C and D, both represent straight lines parallel to the axes. A line parallel to X-axis means, y is constant. That is the parameter represented in the y-axis has a constant value and vice versa.
Formula used:
In a time-temperature graph (generally speaking $x - y$ graph), the x-axis represents time and the y-axis represents temperature. The graph represents the variation of temperature with respect to time.
Complete step by step answer:
Here we have four cases of time and temperature variation.
Let us study each one separately.
A) Here, the temperature is increasing as time increases. It is a valid case.
B) Here, the temperature is decreasing as time increases, which is also a valid case.
C) In this case, the temperature is increasing in constant time. This case is invalid since the different temperature is not possible at a time.
D) In this case, the temperature remains constant as time increases, which is also possible.
Therefore, the possible cases are A, B, and D.
Additional information:
Graphs are basically used to express the collected or observed information in a way that is easier to understand and compare. It is used in different fields at times. The slope of the graph represents the derivative of the function in the y-axis with respect to the function in the x-axis.
Note:
We must be careful in understanding from the graph what is constant and what is varying. Here in cases C and D, both represent straight lines parallel to the axes. A line parallel to X-axis means, y is constant. That is the parameter represented in the y-axis has a constant value and vice versa.
Recently Updated Pages
Master Class 11 English: Engaging Questions & Answers for Success
Master Class 11 Social Science: Engaging Questions & Answers for Success
Master Class 11 Maths: Engaging Questions & Answers for Success
Master Class 11 Biology: Engaging Questions & Answers for Success
Master Class 11 Physics: Engaging Questions & Answers for Success
Master Class 11 Chemistry: Engaging Questions & Answers for Success
Trending doubts
In Indian rupees 1 trillion is equal to how many c class 8 maths CBSE
What is BLO What is the full form of BLO class 8 social science CBSE
What helps Frog to breathe underwater class 8 biology CBSE
Citizens of India can vote at the age of A 18 years class 8 social science CBSE
Which of the following leader has given the term insensate class 8 social science CBSE
Name the states through which the Tropic of Cancer class 8 social science CBSE