


How can the average rate of change be interpreted from a graph or a function?
Answer
562.8k+ views
Hint: In the given question, we have been asked to interpret the average rate of range from a function or a graph. Rate of change is the change in the output with respect to the change in the input over a specific period of time. If we know about the data of output and input at the beginning or at the ending, we can easily find the average rate of change.
Complete step by step solution:
Interpretation of average rate of change from a function:
To find the average rate of change over a specific period of time, we only use data at the beginning and the date at the end.
Let,
The initial output or output at the beginning be \[{{y}_{1}}\] and the initial input or input at the beginning be \[{{x}_{1}}\].
And the output at the end be \[{{y}_{2}}\] and the input at the beginning be \[{{x}_{2}}\].
To find the average rate of change, we divide the change in the output value by the change in input value. Value of change represents by a sign \['\Delta '\],
Change in output value = \[\Delta y\]= \[{{y}_{2}}-{{y}_{1}}\]
Change in input value = \[\Delta x\] = \[{{x}_{2}}-{{x}_{1}}\]
Therefore,
\[Average\ rate\ of\ change=\dfrac{change\ in\ output}{change\ in\ input}=\dfrac{\Delta y}{\Delta x}=\dfrac{{{y}_{2}}-{{y}_{1}}}{{{x}_{2}}-{{x}_{1}}}\]
Sometimes we write \[\Delta f\] instead of \[\Delta y\]. It does not mean that we are changing the function, it still represents the change in function’s output value relative to the change in the input value.
Therefore,
\[\dfrac{\Delta y}{\Delta x}=\dfrac{f\left( {{x}_{2}} \right)-f\left( {{x}_{1}} \right)}{{{x}_{2}}-{{x}_{1}}}\]
Interpretation of average rate of return from a graph:
The initial output or output at the beginning be \[{{y}_{1}}\] and the initial input or input at the beginning be \[{{x}_{1}}\].
And the output at the end be \[{{y}_{2}}\] and the input at the beginning be \[{{x}_{2}}\].
To find the average rate of change, we divide the change in the output value by the change in input value. Value of change represents by a sign \['\Delta '\],
Change in output value = \[\Delta y\]= \[{{y}_{2}}-{{y}_{1}}\]
Change in input value = \[\Delta x\] = \[{{x}_{2}}-{{x}_{1}}\]
Therefore,
\[Average\ rate\ of\ change=\dfrac{change\ in\ output}{change\ in\ input}=\dfrac{\Delta y}{\Delta x}=\dfrac{{{y}_{2}}-{{y}_{1}}}{{{x}_{2}}-{{x}_{1}}}=m=SLOPE\]
\[slope=m=\dfrac{vertical\ change}{horizontal\ chnage}\]
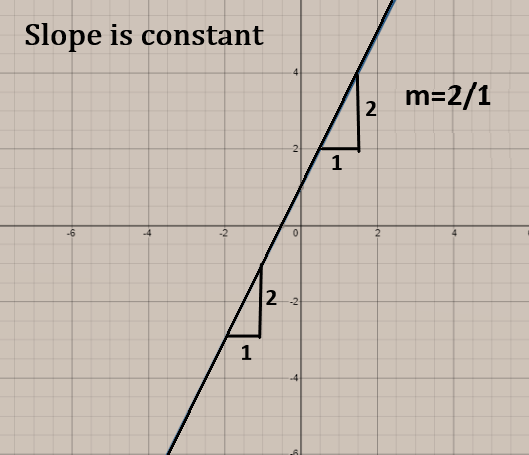
When we find the average rate of change for a linear functions i.e. straight lines, then we find out different values of \[x\] and \[y\] that will satisfy the linear function.
For ex: let the linear function be \[y=2x+1\]
Finding the values of \[x\] and \[y\],
\[slope=m=\dfrac{{{y}_{2}}-{{y}_{1}}}{{{x}_{2}}-{{x}_{1}}}\]
\[\Rightarrow m=\dfrac{3-1}{1-0}\]
\[\Rightarrow m=\dfrac{2}{1}\]
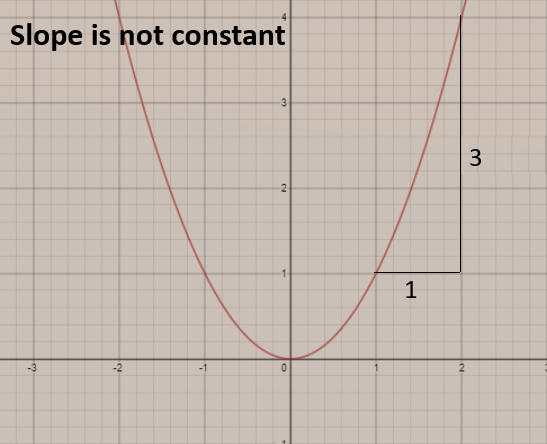
When we find the average rate of change for a non-linear functions, then we find out different values of \[x\] and \[y\] that will satisfy the non-linear function.
For ex: \[y={{x}^{2}}\]
Finding the values of \[x\] and \[y\],
\[slope=m=\dfrac{{{y}_{2}}-{{y}_{1}}}{{{x}_{2}}-{{x}_{1}}}\]
\[\Rightarrow m=\dfrac{4-1}{2-1}\]
\[\Rightarrow m=\dfrac{3}{1}\]
Graph for the respective function given above,
Note: Rate of change is the change in the output with respect to the change in the input over a specific period of time. When you are finding the average rate of return, you are finding the rate at which the output i.e. the \[y\] function is changing with respect to the change in the input i.e. \[x\] function. We should know the basic concept of drawing graphs then this question will be easily solved.
Complete step by step solution:
Interpretation of average rate of change from a function:
To find the average rate of change over a specific period of time, we only use data at the beginning and the date at the end.
Let,
The initial output or output at the beginning be \[{{y}_{1}}\] and the initial input or input at the beginning be \[{{x}_{1}}\].
And the output at the end be \[{{y}_{2}}\] and the input at the beginning be \[{{x}_{2}}\].
To find the average rate of change, we divide the change in the output value by the change in input value. Value of change represents by a sign \['\Delta '\],
Change in output value = \[\Delta y\]= \[{{y}_{2}}-{{y}_{1}}\]
Change in input value = \[\Delta x\] = \[{{x}_{2}}-{{x}_{1}}\]
Therefore,
\[Average\ rate\ of\ change=\dfrac{change\ in\ output}{change\ in\ input}=\dfrac{\Delta y}{\Delta x}=\dfrac{{{y}_{2}}-{{y}_{1}}}{{{x}_{2}}-{{x}_{1}}}\]
Sometimes we write \[\Delta f\] instead of \[\Delta y\]. It does not mean that we are changing the function, it still represents the change in function’s output value relative to the change in the input value.
Therefore,
\[\dfrac{\Delta y}{\Delta x}=\dfrac{f\left( {{x}_{2}} \right)-f\left( {{x}_{1}} \right)}{{{x}_{2}}-{{x}_{1}}}\]
Interpretation of average rate of return from a graph:
The initial output or output at the beginning be \[{{y}_{1}}\] and the initial input or input at the beginning be \[{{x}_{1}}\].
And the output at the end be \[{{y}_{2}}\] and the input at the beginning be \[{{x}_{2}}\].
To find the average rate of change, we divide the change in the output value by the change in input value. Value of change represents by a sign \['\Delta '\],
Change in output value = \[\Delta y\]= \[{{y}_{2}}-{{y}_{1}}\]
Change in input value = \[\Delta x\] = \[{{x}_{2}}-{{x}_{1}}\]
Therefore,
\[Average\ rate\ of\ change=\dfrac{change\ in\ output}{change\ in\ input}=\dfrac{\Delta y}{\Delta x}=\dfrac{{{y}_{2}}-{{y}_{1}}}{{{x}_{2}}-{{x}_{1}}}=m=SLOPE\]
\[slope=m=\dfrac{vertical\ change}{horizontal\ chnage}\]
When we find the average rate of change for a linear functions i.e. straight lines, then we find out different values of \[x\] and \[y\] that will satisfy the linear function.
For ex: let the linear function be \[y=2x+1\]
Finding the values of \[x\] and \[y\],
| X | 0 | 1 |
| y | 1 | 3 |
\[slope=m=\dfrac{{{y}_{2}}-{{y}_{1}}}{{{x}_{2}}-{{x}_{1}}}\]
\[\Rightarrow m=\dfrac{3-1}{1-0}\]
\[\Rightarrow m=\dfrac{2}{1}\]
When we find the average rate of change for a non-linear functions, then we find out different values of \[x\] and \[y\] that will satisfy the non-linear function.
For ex: \[y={{x}^{2}}\]
Finding the values of \[x\] and \[y\],
| x | 1 | 2 |
| y | 1 | 4 |
\[slope=m=\dfrac{{{y}_{2}}-{{y}_{1}}}{{{x}_{2}}-{{x}_{1}}}\]
\[\Rightarrow m=\dfrac{4-1}{2-1}\]
\[\Rightarrow m=\dfrac{3}{1}\]
Graph for the respective function given above,
Note: Rate of change is the change in the output with respect to the change in the input over a specific period of time. When you are finding the average rate of return, you are finding the rate at which the output i.e. the \[y\] function is changing with respect to the change in the input i.e. \[x\] function. We should know the basic concept of drawing graphs then this question will be easily solved.
Recently Updated Pages
Master Class 12 Social Science: Engaging Questions & Answers for Success
Master Class 12 Physics: Engaging Questions & Answers for Success
Master Class 12 Maths: Engaging Questions & Answers for Success
Master Class 12 Economics: Engaging Questions & Answers for Success
Master Class 12 Chemistry: Engaging Questions & Answers for Success
Master Class 12 Business Studies: Engaging Questions & Answers for Success
Trending doubts
Which are the Top 10 Largest Countries of the World?
Draw a labelled sketch of the human eye class 12 physics CBSE
Explain the structure of megasporangium class 12 biology CBSE
What are the major means of transport Explain each class 12 social science CBSE
How many chromosomes are found in human ovum a 46 b class 12 biology CBSE
The diagram of the section of a maize grain is given class 12 biology CBSE