


What is the average number of vehicles manufactured by Company $X$ over the given period? (round off to nearest integer)
A. $119333$
B. $113666$
C. $112778$
D. $111223$
Answer
501.3k+ views
Hint: Here it is given a line graph of two company numbers of vehicles manufactured along a series of years. As we have to find the average number of vehicles manufactured by a company $X$ in six years we will firstly write down the vehicle manufactured each year . As it is given that the values are in thousand we will rewrite the numbers accordingly. Finally by using the average formula we will get our desired answer.
Complete answer:
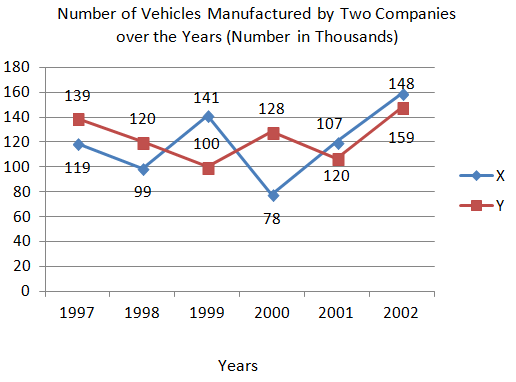
The graph is given as follows:

The Blue line denotes the number of vehicles manufactured by company $X$.
So we can get the numbers of vehicles manufactured each year as follows:
In Year $1997$ vehicle manufactured is $119$
In Year $1998$ vehicle manufactured is $99$
In Year $1999$ vehicle manufactured is $141$
In Year $2000$ vehicle manufactured is $78$
In Year $2001$ vehicle manufactured is $120$
In Year $2002$ vehicle manufactured is $159$
As the $y-axis$ indicate the number of vehicles in thousand so we will rewrite the values as follows:
For $1997$ vehicle manufactured $119000$
For $1998$ vehicle manufactured $99000$
For $1999$ vehicle manufactured $141000$
For $2000$ vehicle manufactured $78000$
For $2001$ vehicle manufactured $120000$
For $2002$ vehicle manufactured $159000$
Average is calculated as follows:
Average $=$ Sum of all value $\div $ Number of values
Average $=\dfrac{119000+99000+141000+78000+120000+159000}{6}$
Average $=\dfrac{716000}{6}$
Average $=119333.33$
So we can write the approximate value as
Average $=119333$
Hence the correct option is (A).
Note:
In the Data Interpretation question it is very necessary that we take care of what each axis is indicating. For the ease of calculation write down the values which are needed from the graph and then proceed with the calculation part. Average means sum of all the values divided by number of values. It is also known as meaning in statistics and many topics of mathematics.
Complete answer:
The graph is given as follows:
The Blue line denotes the number of vehicles manufactured by company $X$.
So we can get the numbers of vehicles manufactured each year as follows:
In Year $1997$ vehicle manufactured is $119$
In Year $1998$ vehicle manufactured is $99$
In Year $1999$ vehicle manufactured is $141$
In Year $2000$ vehicle manufactured is $78$
In Year $2001$ vehicle manufactured is $120$
In Year $2002$ vehicle manufactured is $159$
As the $y-axis$ indicate the number of vehicles in thousand so we will rewrite the values as follows:
For $1997$ vehicle manufactured $119000$
For $1998$ vehicle manufactured $99000$
For $1999$ vehicle manufactured $141000$
For $2000$ vehicle manufactured $78000$
For $2001$ vehicle manufactured $120000$
For $2002$ vehicle manufactured $159000$
Average is calculated as follows:
Average $=$ Sum of all value $\div $ Number of values
Average $=\dfrac{119000+99000+141000+78000+120000+159000}{6}$
Average $=\dfrac{716000}{6}$
Average $=119333.33$
So we can write the approximate value as
Average $=119333$
Hence the correct option is (A).
Note:
In the Data Interpretation question it is very necessary that we take care of what each axis is indicating. For the ease of calculation write down the values which are needed from the graph and then proceed with the calculation part. Average means sum of all the values divided by number of values. It is also known as meaning in statistics and many topics of mathematics.
Recently Updated Pages
Master Class 12 Economics: Engaging Questions & Answers for Success
Master Class 12 Physics: Engaging Questions & Answers for Success
Master Class 12 English: Engaging Questions & Answers for Success
Master Class 12 Social Science: Engaging Questions & Answers for Success
Master Class 12 Maths: Engaging Questions & Answers for Success
Master Class 12 Business Studies: Engaging Questions & Answers for Success
Trending doubts
Which are the Top 10 Largest Countries of the World?
What are the major means of transport Explain each class 12 social science CBSE
Draw a labelled sketch of the human eye class 12 physics CBSE
Why cannot DNA pass through cell membranes class 12 biology CBSE
Differentiate between insitu conservation and exsitu class 12 biology CBSE
Draw a neat and well labeled diagram of TS of ovary class 12 biology CBSE