


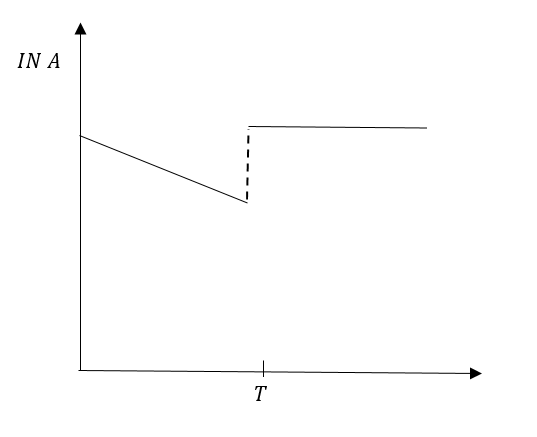
At time $t = 0,$ some radioactive gas is injected into a sealed vessel. At times $T$ some more of the same gas injected into the same vessel. Which one of the following graphs best (represents the variation of the logarithm of the activity $A$ of the gas with time $t$?
A.
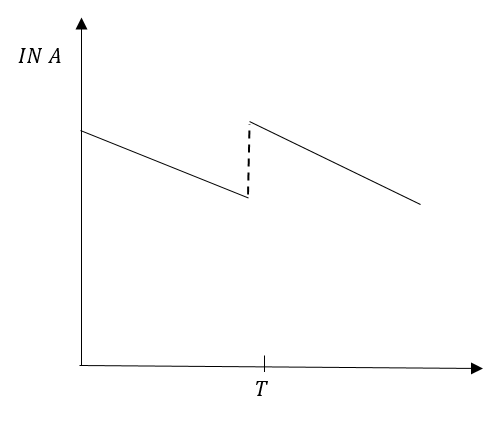
B.
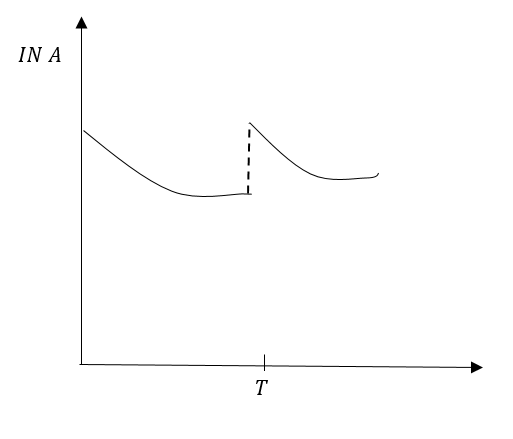
C.
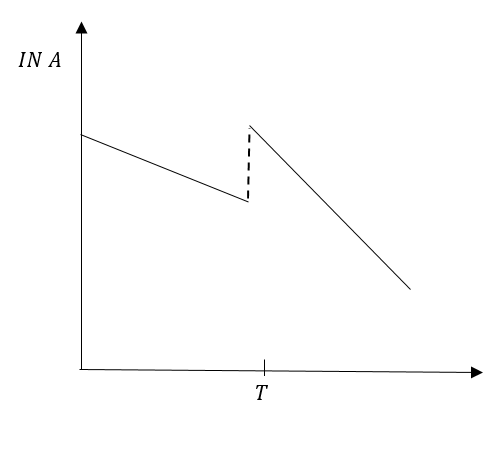
D.
E.
Answer
579.6k+ views
Hint: Use the formula of decay in the mass of gas then take logarithm to both the sides to predict the graph.
$N = N_o{e^{ - \lambda t}}$
Complete step by step answer:
We know that the numerator of nuclei in a gas at time $t$ is given by
$N_o{e^{ - \lambda t}}$
Where,
N is the number of nucleus of a gas at time t.
$N_o$ is the initial number of nucleus at time $t = 0$
$\lambda $is the decay constant.
Since $A$is given in the question, replace $A$ with $N$ and ${A_0}$ with $N_o$, we get
$A = {A_1}{e^{ - \lambda t}}$
We need to find the variation in logarithm of $A$ with respect to time.
Take ${\log _e}$to both sides of equation (1)
\[ = {\log _e}{A_0} + {\log _e}{e^{ - \lambda t}}\left( {\because \log ab = \log a + \log b} \right)\]
$ = {\log _e}{A_0} - \lambda t{\log _e}^e\left( {\because \log {a^b} = b\log a} \right)$
$ = {\log _e}{A_0} - \lambda t\left( {\because {{\log }_a}^a = 1} \right)$
Now, ${\log _e}{A_0}$ is constant
Put ${\log _e}{A_0} = k$
And put $\log A = y$
Then we get
$y = k - \lambda t$
By rearranging, we get
$y = - \lambda t + k$ . . . . . (2)
Which is in the form,
$y = mx + c$
Which is a straight line of slope in equation (2) is a straight line of slope $ - \lambda $
Since, more gas was added at time T. The graph of the straight line will break but the step of line will not change.
Graph in option (B) represents our conclusion in the best possible way.
So, the correct answer is “Option B”.
Note:
You need to understand the behaviour of graphs to solve such questions.
In option (A) the line is parallel to the axis after time T, that means the slope is zero. Therefore, option (A) IS INCORRECT.
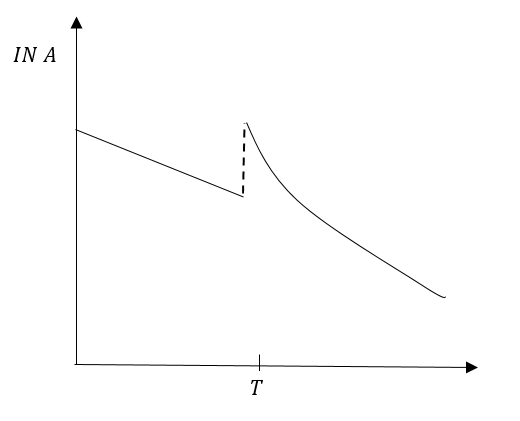
In option (C) the graph B is not a straight line that means the slope is changing at an energy point. Therefore, option (C) is moment.
In option (D0, inclination of line before time T and after time T is visibly different. That means the slope before time T and after time T is different. Therefore, option (D) is incorrect.
In option (A), graph before time T is a straight line but the graph after time T is not correct. Therefore, option (C) IS INCORRECT.
$N = N_o{e^{ - \lambda t}}$
Complete step by step answer:
We know that the numerator of nuclei in a gas at time $t$ is given by
$N_o{e^{ - \lambda t}}$
Where,
N is the number of nucleus of a gas at time t.
$N_o$ is the initial number of nucleus at time $t = 0$
$\lambda $is the decay constant.
Since $A$is given in the question, replace $A$ with $N$ and ${A_0}$ with $N_o$, we get
$A = {A_1}{e^{ - \lambda t}}$
We need to find the variation in logarithm of $A$ with respect to time.
Take ${\log _e}$to both sides of equation (1)
\[ = {\log _e}{A_0} + {\log _e}{e^{ - \lambda t}}\left( {\because \log ab = \log a + \log b} \right)\]
$ = {\log _e}{A_0} - \lambda t{\log _e}^e\left( {\because \log {a^b} = b\log a} \right)$
$ = {\log _e}{A_0} - \lambda t\left( {\because {{\log }_a}^a = 1} \right)$
Now, ${\log _e}{A_0}$ is constant
Put ${\log _e}{A_0} = k$
And put $\log A = y$
Then we get
$y = k - \lambda t$
By rearranging, we get
$y = - \lambda t + k$ . . . . . (2)
Which is in the form,
$y = mx + c$
Which is a straight line of slope in equation (2) is a straight line of slope $ - \lambda $
Since, more gas was added at time T. The graph of the straight line will break but the step of line will not change.
Graph in option (B) represents our conclusion in the best possible way.
So, the correct answer is “Option B”.
Note:
You need to understand the behaviour of graphs to solve such questions.
In option (A) the line is parallel to the axis after time T, that means the slope is zero. Therefore, option (A) IS INCORRECT.
In option (C) the graph B is not a straight line that means the slope is changing at an energy point. Therefore, option (C) is moment.
In option (D0, inclination of line before time T and after time T is visibly different. That means the slope before time T and after time T is different. Therefore, option (D) is incorrect.
In option (A), graph before time T is a straight line but the graph after time T is not correct. Therefore, option (C) IS INCORRECT.
Recently Updated Pages
Master Class 12 Economics: Engaging Questions & Answers for Success
Master Class 12 Physics: Engaging Questions & Answers for Success
Master Class 12 English: Engaging Questions & Answers for Success
Master Class 12 Social Science: Engaging Questions & Answers for Success
Master Class 12 Maths: Engaging Questions & Answers for Success
Master Class 12 Business Studies: Engaging Questions & Answers for Success
Trending doubts
Which are the Top 10 Largest Countries of the World?
What are the major means of transport Explain each class 12 social science CBSE
Draw a labelled sketch of the human eye class 12 physics CBSE
Why cannot DNA pass through cell membranes class 12 biology CBSE
Differentiate between insitu conservation and exsitu class 12 biology CBSE
Draw a neat and well labeled diagram of TS of ovary class 12 biology CBSE