


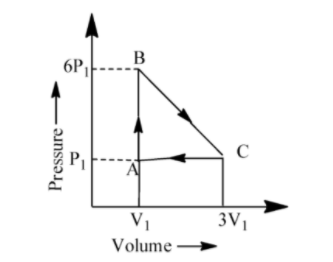
An ideal gas is taken around the cycle ABCA as shown in P-V diagram. The network done by the gas during the cycle is equal to:
A. \[12{{P}_{1}}{{V}_{1}}\]
B. \[6{{P}_{1}}{{V}_{1}}\]
C. \[5{{P}_{1}}{{V}_{1}}\]
D. \[{{P}_{1}}{{V}_{1}}\]
Answer
563.3k+ views
Hint: A gas whose molecules occupy negligible space and have no interactions between, and which consequently obeys the all gas laws at all temperatures and pressure is called ideal gas.
For an ideal gas\[PV=nRT\]. Where P =Pressure, V = Volume, n = number of moles, R =gas constant, and T = Temperature.
Complete step by step answer:
We know that work done for the process which is showing in the graph is the Area under the curve.
Net Work done by the gas during the cycle = Area under the curve ABCA or area of the triangle ABCA.
Work done
\[\begin{align}
& =\frac{1}{2}AC\times BC \\
& =\frac{1}{2}(3V-V)(6P-P) \\
& =\frac{1}{2}(2V)(5P) \\
& =5PV \\
\end{align}\]
Therefore the net work done by the gas during the cycle is equal to 5PV.
So, the correct answer is “Option C”.
Additional information:
1. A suitable way to visualize the changes in the pressure and volume is Pressure-Volume diagram or Pressure-Volume graph.
2. Each point in a Pressure - Volume graph corresponds to a various states of the gas. The pressure is taken on the vertical axis and the volume is taken on the horizontal axis.
Note:
At the time of calculating area from the diagram or graph, we are supposed to do subtraction of 6P from P nor P from 6P and in case of volume also we have to do subtraction of 3V from V not V from 3V. Because the area won’t be a negative value.
Recently Updated Pages
Master Class 11 English: Engaging Questions & Answers for Success
Master Class 11 Social Science: Engaging Questions & Answers for Success
Master Class 11 Maths: Engaging Questions & Answers for Success
Master Class 11 Biology: Engaging Questions & Answers for Success
Master Class 11 Physics: Engaging Questions & Answers for Success
Master Class 11 Chemistry: Engaging Questions & Answers for Success
Trending doubts
One Metric ton is equal to kg A 10000 B 1000 C 100 class 11 physics CBSE
Difference Between Prokaryotic Cells and Eukaryotic Cells
Find the value of the expression given below sin 30circ class 11 maths CBSE
Difference between physical and chemical change class 11 chemistry CBSE
Two of the body parts which do not appear in MRI are class 11 biology CBSE
Draw a diagram of a plant cell and label at least eight class 11 biology CBSE