


A student is comparing traits for five related bird species. They make a chart and record data for four different traits. They then use the chart to make a cladogram showing their hypothesized relationships between the species.
1 2 3 4 5 Head Size 20 cm 20 cm 20 cm 20 cm 20 cm Beak Color Black Blue Blue Black Black Eye Color Black Black Red Red Red Eye Number 2 2 2 2 3
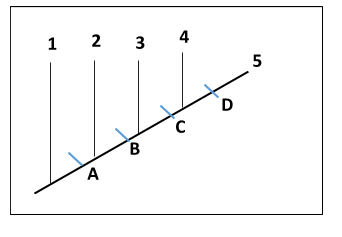
What occurred at point C on the cladogram?
A. Head size increased.
B. Red eyes developed.
C. The beak color of the common ancestor of Species 4 and 5 changed from blue to black.
D. The descendants of Species 3 diverged to become Species 4 and Species 5.
| 1 | 2 | 3 | 4 | 5 | |
| Head Size | 20 cm | 20 cm | 20 cm | 20 cm | 20 cm |
| Beak Color | Black | Blue | Blue | Black | Black |
| Eye Color | Black | Black | Red | Red | Red |
| Eye Number | 2 | 2 | 2 | 2 | 3 |
Answer
569.4k+ views
Hint:-A cladogram is a diagram used to display relations between species in cladistics. However a cladogram is not an evolutionary tree since it does not demonstrate how descendants are bound to ancestors, nor does it show how much they have evolved, meaning that se
Complete Answer:-A cladogram uses lines that branch out into a clade, a group of species with a last common ancestor, in various directions. Cladograms have several forms, but they all have lines that branch out from other lines. It is possible to follow the lines back to where they branch out. These branching off points represent a hypothetical ancestor (not an individual entity) that can be inferred from the above to show the characteristics shared between the terminal taxa. This hypothetical ancestor could then include clues regarding the order of evolution of different traits, adaptation, and other ancestor evolutionary narratives.
In the figure given above, the other features at point C do not change other than the beak colour that changes from Blue to Black. Therefore the right answer is option C, i.e “The beak colour of the common ancestor of Species 4 and 5 changed from blue to black”.
Note:- The DNA and RNA sequencing data and computational phylogenetics are now very widely used in the generation of cladograms, either on their own or in conjunction with morphology, whereas historically such cladograms were mostly created based on morphological characters.
Recently Updated Pages
Master Class 12 English: Engaging Questions & Answers for Success
Master Class 12 Social Science: Engaging Questions & Answers for Success
Master Class 12 Maths: Engaging Questions & Answers for Success
Master Class 12 Economics: Engaging Questions & Answers for Success
Master Class 12 Physics: Engaging Questions & Answers for Success
Master Class 12 Business Studies: Engaging Questions & Answers for Success
Trending doubts
Which are the Top 10 Largest Countries of the World?
What are the major means of transport Explain each class 12 social science CBSE
Draw a labelled sketch of the human eye class 12 physics CBSE
Draw the diagram showing the germination of pollen class 12 biology CBSE
Differentiate between insitu conservation and exsitu class 12 biology CBSE
RNA and DNA are chiral molecules their chirality is class 12 chemistry CBSE