


A histogram consists of
A. sectors
B. rectangles
C. triangle
D. squares
Answer
529.8k+ views
Hint: Here we have been asked what a histogram consists of. Firstly we will write the definition of histogram then we will give an image of how it is drawn. Then by using the figure we will see what type of shape it consists of. Finally we will conclude our answer as what a histogram consists of and get our desired answer.
Complete step-by-step solution:
We have to show what a histogram consists of,
Firstly we know that a histogram is used to represent a numerical distribution of data where the interval is given. To draw a histogram we divide the entire range of values into a series of intervals and then count how many values fall into each interval.
The histogram is drawn as follows,
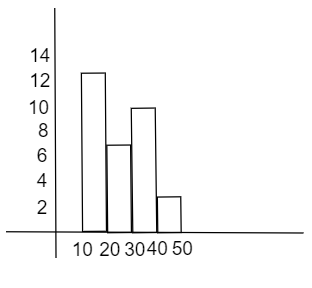
Where the vertical axis is our interval and the horizontal axis is frequency.
Now as we can see that the histogram consists of rectangles which have the bases along the interval between the class boundaries and area which is proportional to the frequencies in the corresponding classes.
So a histogram consists of rectangles.
Hence correct option is (B).
Note: Histogram is a very useful way of representing the distribution of numerical data. It is the graphical representation of a grouped frequency distribution which has continuous classes. It is an area diagram and can be defined as rectangles. All the rectangles are adjacent as the classes are continuous. The height of the rectangle denotes the frequency of that particular class and the width is equal to the class interval of the distribution.
Complete step-by-step solution:
We have to show what a histogram consists of,
Firstly we know that a histogram is used to represent a numerical distribution of data where the interval is given. To draw a histogram we divide the entire range of values into a series of intervals and then count how many values fall into each interval.
The histogram is drawn as follows,
Where the vertical axis is our interval and the horizontal axis is frequency.
Now as we can see that the histogram consists of rectangles which have the bases along the interval between the class boundaries and area which is proportional to the frequencies in the corresponding classes.
So a histogram consists of rectangles.
Hence correct option is (B).
Note: Histogram is a very useful way of representing the distribution of numerical data. It is the graphical representation of a grouped frequency distribution which has continuous classes. It is an area diagram and can be defined as rectangles. All the rectangles are adjacent as the classes are continuous. The height of the rectangle denotes the frequency of that particular class and the width is equal to the class interval of the distribution.
Recently Updated Pages
Master Class 12 Economics: Engaging Questions & Answers for Success
Master Class 12 English: Engaging Questions & Answers for Success
Master Class 12 Social Science: Engaging Questions & Answers for Success
Master Class 12 Maths: Engaging Questions & Answers for Success
Master Class 12 Physics: Engaging Questions & Answers for Success
Master Class 9 General Knowledge: Engaging Questions & Answers for Success
Trending doubts
Find the sum of series 1 + 2 + 3 + 4 + 5 + + 100 class 9 maths CBSE
Difference Between Plant Cell and Animal Cell
Fill the blanks with the suitable prepositions 1 The class 9 english CBSE
What is pollution? How many types of pollution? Define it
Name 10 Living and Non living things class 9 biology CBSE
What is the full form of pH?