


A digital balance is used to weigh ingredients in a laboratory. When a weight is applied to the digital balance, an electronic circuit generates a current which is then converted into a digital readout on the display.
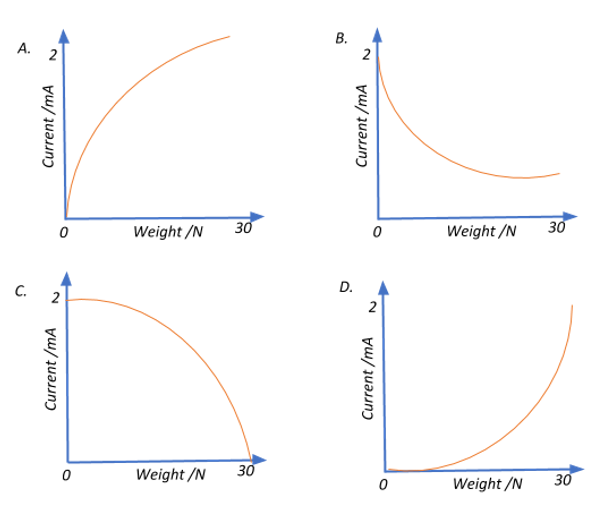
The electric circuit gives a current $2\;mA$ when a weight of $30\; N$ is applied, and a current of $0.5\;mA$ when a weight of $5\; N$ is applied. Which calibration curve could represent this circuit?
Answer
613.5k+ views
Hint: A good way to start would be to deduce the behavior of the current flow with weight. In other words, find the average slope in each case and determine if the slope increases or decreases with weight. This should be able to point you to the right curve and narrow it down from the rest.
Formula Used:
Slope of a curve determined between two points $(x_1,y_1)$ and $(x_2,y_2)$ is given by $\dfrac{y_2 -y_1}{x_2-x_1}$
Complete step-by-step solution:
The nature of any curve can be established by calculating the slope of the curve at multiple data points or instants. The slope of the curve basically represents how one value is subject to change when the other value changes by a unit.
Now, a digital balance works in such a way that when an object is placed, the weight of the body causes the current flowing through it to change. This change in current is obtained by extrapolating the calibration curve to our digital reading on the balance
If we take the example given to us, our calibration curve has current on the y-axis and weight on the x-axis. Now, assume you want to know the current that flows through when you place an object of 5 kgs. Without having to make a separate circuit or taking the balance apart, we can find the current that passes through by tracing along the calibration curve until it points to 5 kgs on the x-axis. The corresponding y-axis reading gives the current that passes through.
Using our definition of a slope, let us find the average slope at the two data points we’ve been given, where we assume that our data points signify the maximum (x,y) value and the minimum value will be at origin (0,0)
a). For when a current $2\;mA = 0.002\;A$ is produced when a weight of $30 N$ is applied:
$x_1 = 0, y_1 = 0, x_2 =30, y_2 = 0.002$
$Slope = \dfrac{y_2-y_1}{x_2-x_1} \Rightarrow Slope_{(30,2)} =\dfrac{0.002-0}{30-0} = \dfrac{1}{15} \times 10^{-3} $
4). For when a current $0.5\;mA = 5 \times10^{-4} \;A$ is produced when a weight of $5\;N$ is applied:
$x_1 = 0, y_1 = 0, x_2 =5, y_2 = 0.0005$
$Slope = \dfrac{y_2-y_1}{x_2-x_1} \Rightarrow Slope_{(5,0.5)} =\dfrac{0.0005-0}{5-0} = \dfrac{1}{10} \times 10^{-3} $
Thus we have got $ Slope_{(5,0.5)} > Slope_{(30,2)} $ since $\dfrac{1}{10}>\dfrac{1}{15}$. But notice that the in the curves given to us, the weight and the current are measured in inverse, therefore, our final slopes after taking the inverse look like:
$ Slope_{(5,0.5)}$ < $Slope_{(30,2)}$ since, then $10$<$15$
Thus we see that the slope is increasing per weight, which also means that there is no current flow when no weight is applied. Therefore, the correct choice would be the graph A.
Note: Remember that a calibration curve, also known as a standard curve is a general method to interpolate values when some data is unknown. A calibration curve thus establishes a standard scale of readings from which we can gauge the values that we require by reading off the curve. Note, that it is very essential to take precision measurements while building a calibration curve as the accuracy of the unknown parameter whose value we need depends on how correct the calibrated values are.
Recently Updated Pages
Master Class 11 Social Science: Engaging Questions & Answers for Success
Master Class 11 English: Engaging Questions & Answers for Success
Master Class 11 Maths: Engaging Questions & Answers for Success
Master Class 11 Chemistry: Engaging Questions & Answers for Success
Master Class 11 Biology: Engaging Questions & Answers for Success
Master Class 11 Physics: Engaging Questions & Answers for Success
Trending doubts
One Metric ton is equal to kg A 10000 B 1000 C 100 class 11 physics CBSE
Difference Between Prokaryotic Cells and Eukaryotic Cells
How many of the following diseases can be studied with class 11 biology CBSE
Two of the body parts which do not appear in MRI are class 11 biology CBSE
Which of the following enzymes is used for carboxylation class 11 biology CBSE
Explain zero factorial class 11 maths CBSE