


Yugendran's progress report card shows his marks as follows. Draw a pie chart exhibiting his marks in various subjects.
Subject Tamil English Mathematics Science Social Science Marks 72 60 84 70 74
| Subject | Tamil | English | Mathematics | Science | Social Science |
| Marks | 72 | 60 | 84 | 70 | 74 |
Answer
584.1k+ views
Hint: In a pie chart, we represent the share of various quantities from a whole in terms of their percentage which means per hundred.
The respective quantities can be converted to percentage using the following method.
Let two quantities be a and b, then their respective percentage is:
$\dfrac{a}{{a + b}} \times 100$ or
$\dfrac{b}{{a + b}} \times 100$
Complete step-by-step answer:
We draw pie charts in a circular manner representing different categories in percentage with different colours.
First we can convert various quantities in terms of percentage:
Sum of all the quantities:
72 + 60 + 84 + 70 + 74 = 360
Percentage of respective quantity can be given by dividing it by the sum of all quantities and multiplying with 100.
Plotting this information on a pie chart:
This is the required pie chart of the given data.
It is important to mention which colours represent which quantity.
Note: $' \approx '$ is used for approximation and is pronounced as approximately equal to. When the term is more than 0.50 then it is rounded off to larger value and when smaller, it is rounded off to the smaller value.
e.g. 16.66 is approximately equal to 17 and not 16 because 0.66 > 0.50 whereas
19.44 is approximately equal to 19 and not 20 because 0.44 < 0.50
The respective quantities can be converted to percentage using the following method.
Let two quantities be a and b, then their respective percentage is:
$\dfrac{a}{{a + b}} \times 100$ or
$\dfrac{b}{{a + b}} \times 100$
Complete step-by-step answer:
We draw pie charts in a circular manner representing different categories in percentage with different colours.
First we can convert various quantities in terms of percentage:
Sum of all the quantities:
72 + 60 + 84 + 70 + 74 = 360
Percentage of respective quantity can be given by dividing it by the sum of all quantities and multiplying with 100.
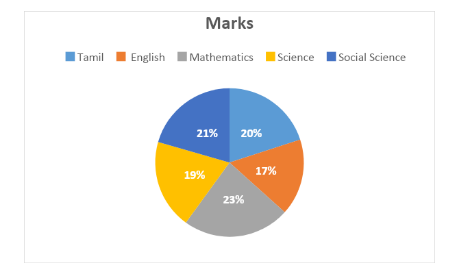
| Subject | Tamil | English | Mathematics | Science | Social Science |
| Marks | 72 | 60 | 84 | 70 | 74 |
| Percentage calculation | $\dfrac{{72}}{{360}} \times 100 = 20$ | $ \dfrac{{60}}{{360}} \times 100 = 16.66 \\ \approx 17 \\ $ | $ \dfrac{{84}}{{360}} \times 100 = 23.33 \\ \approx 23 \\ $ | $ \dfrac{{70}}{{360}} \times 100 = 19.44 \\ \approx 19 \\ $ | $ \dfrac{{74}}{{360}} \times 100 = 20.55 \\ \approx 21 \\ $ |
| Percentage | 20 % | 17 % | 23 % | 19 % | 21 % |
Plotting this information on a pie chart:
This is the required pie chart of the given data.
It is important to mention which colours represent which quantity.
Note: $' \approx '$ is used for approximation and is pronounced as approximately equal to. When the term is more than 0.50 then it is rounded off to larger value and when smaller, it is rounded off to the smaller value.
e.g. 16.66 is approximately equal to 17 and not 16 because 0.66 > 0.50 whereas
19.44 is approximately equal to 19 and not 20 because 0.44 < 0.50
Recently Updated Pages
Master Class 9 General Knowledge: Engaging Questions & Answers for Success
Master Class 9 Social Science: Engaging Questions & Answers for Success
Master Class 9 English: Engaging Questions & Answers for Success
Master Class 9 Maths: Engaging Questions & Answers for Success
Master Class 9 Science: Engaging Questions & Answers for Success
Class 9 Question and Answer - Your Ultimate Solutions Guide
Trending doubts
Find the mode and median of the data 13 16 12 14 1-class-9-maths-CBSE
What were the main changes brought about by the Bolsheviks class 9 social science CBSE
What is the theme or message of the poem The road not class 9 english CBSE
What are the major achievements of the UNO class 9 social science CBSE
Explain the importance of pH in everyday life class 9 chemistry CBSE
Differentiate between parenchyma collenchyma and sclerenchyma class 9 biology CBSE