


Which of the two days did they export more bottles of pickles?
A) Monday and Wednesday
B) Thursday and Friday
C) Monday and Thursday
D) Tuesday and Friday
Answer
624.3k+ views
Hint: A pictograph is the representation of data using images. We have to find the two days they export more bottles of pickles. For that we use the given information, we can represent the pictograph into the table of numbers. From there we can identify on which two days more bottles of pickles are exported.
Complete step-by-step solution:
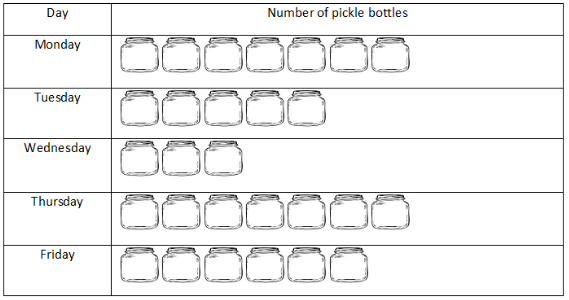
Here, a pictograph is given. It is the number of bottles of pickles that are exported in a week.
We have to find out the days when the greatest number of bottles of pickles are exported.
As per the given table we can say that,
On Monday seven bottles of pickles are exported.
On Tuesday five bottles of pickles are exported.
On Wednesday three bottles of pickles are exported.
On Thursday seven bottles of pickles are exported.
On Friday six bottles of pickles are exported.
We can conclude that, one Monday and Thursday seven bottles of pickles are exported which is the greatest in number.
So, they exported more bottles of pickles on Monday and Thursday.
Hence, the correct option is C.
Note: A pictograph is the representation of data using images. Pictographs represent the frequency of data while using symbols or images that are relevant to the data. This is one of the simplest ways to represent statistical data. And reading a pictograph is made extremely easy as well. Pictographs are easy to read since all the information is available at one glance. It attracts attention as it is represented by symbols.
Complete step-by-step solution:
Here, a pictograph is given. It is the number of bottles of pickles that are exported in a week.
We have to find out the days when the greatest number of bottles of pickles are exported.
As per the given table we can say that,
On Monday seven bottles of pickles are exported.
On Tuesday five bottles of pickles are exported.
On Wednesday three bottles of pickles are exported.
On Thursday seven bottles of pickles are exported.
On Friday six bottles of pickles are exported.
We can conclude that, one Monday and Thursday seven bottles of pickles are exported which is the greatest in number.
So, they exported more bottles of pickles on Monday and Thursday.
Hence, the correct option is C.
Note: A pictograph is the representation of data using images. Pictographs represent the frequency of data while using symbols or images that are relevant to the data. This is one of the simplest ways to represent statistical data. And reading a pictograph is made extremely easy as well. Pictographs are easy to read since all the information is available at one glance. It attracts attention as it is represented by symbols.
Recently Updated Pages
Basicity of sulphurous acid and sulphuric acid are
Master Class 11 English: Engaging Questions & Answers for Success
Master Class 11 Physics: Engaging Questions & Answers for Success
Master Class 11 Computer Science: Engaging Questions & Answers for Success
Master Class 11 Chemistry: Engaging Questions & Answers for Success
Master Class 11 Social Science: Engaging Questions & Answers for Success
Trending doubts
Difference Between Prokaryotic Cells and Eukaryotic Cells
Two of the body parts which do not appear in MRI are class 11 biology CBSE
One Metric ton is equal to kg A 10000 B 1000 C 100 class 11 physics CBSE
10 examples of friction in our daily life
Draw a diagram of nephron and explain its structur class 11 biology CBSE
What will happen if the mucus is not secreted by the class 11 biology CBSE