


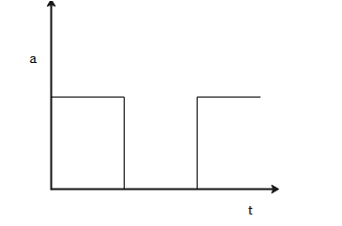
Which of the following would probably show the velocity-time graph for a body whose acceleration time graph is shown below?
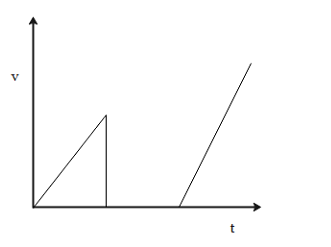
A.

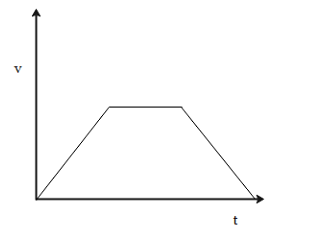
B.
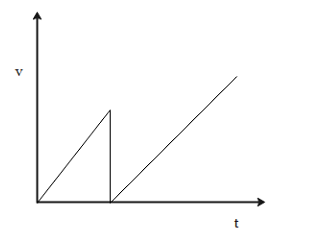
C.
D.
Answer
571.8k+ views
Hint: We need to use the fact that the velocity can be obtained by integrating the acceleration with time. Since integration involves the area under the curve, we need to analyse the variation of area under the curve of the acceleration-time graph to obtain the velocity –time graph.
Complete step by step answer:
We know that acceleration is equal to the derivative of velocity with respect to time. So, the velocity can be obtained by taking the time integral of acceleration.
\[
a = \dfrac{{dv}}{{dt}} \\
v = \int {adt} \\
\]
Therefore, we need to study the area under the curve for the acceleration-time graph in order to obtain the velocity time graph.
Consider the given plot for acceleration and time.

We can make the following observations for the area under the curve which represents the variation of velocity with time.
1. As we go from O to a, we notice that the area under the curve goes on increasing linearly. Therefore, from O to a, the velocity increases linearly.
2. At the area becomes zero and stays zero upto b. This means that acceleration is zero and corresponding to it the velocity will remain constant.
3. From b, the area starts increasing and beyond b, the area increases linearly just like the first case. So, after point b, the velocity increases linearly.
Based on these observations, we can have the following variation of velocity with time.
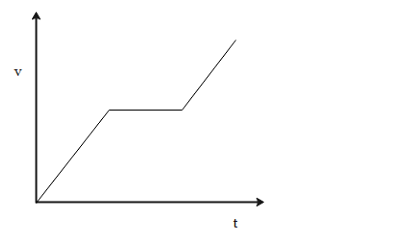
Based on this, the correct answer to the question is option A.
Note:
It should be noted that in order to obtain a curve for a quantity based on the curve for the related quantity, first we need to know how they are related to each other. In case if we had to obtain a plot for acceleration from velocity then we know that acceleration is equal to the time derivative of velocity. Then we study the slope of the velocity-time graph.
Complete step by step answer:
We know that acceleration is equal to the derivative of velocity with respect to time. So, the velocity can be obtained by taking the time integral of acceleration.
\[
a = \dfrac{{dv}}{{dt}} \\
v = \int {adt} \\
\]
Therefore, we need to study the area under the curve for the acceleration-time graph in order to obtain the velocity time graph.
Consider the given plot for acceleration and time.
We can make the following observations for the area under the curve which represents the variation of velocity with time.
1. As we go from O to a, we notice that the area under the curve goes on increasing linearly. Therefore, from O to a, the velocity increases linearly.
2. At the area becomes zero and stays zero upto b. This means that acceleration is zero and corresponding to it the velocity will remain constant.
3. From b, the area starts increasing and beyond b, the area increases linearly just like the first case. So, after point b, the velocity increases linearly.
Based on these observations, we can have the following variation of velocity with time.
Based on this, the correct answer to the question is option A.
Note:
It should be noted that in order to obtain a curve for a quantity based on the curve for the related quantity, first we need to know how they are related to each other. In case if we had to obtain a plot for acceleration from velocity then we know that acceleration is equal to the time derivative of velocity. Then we study the slope of the velocity-time graph.
Recently Updated Pages
Master Class 11 Computer Science: Engaging Questions & Answers for Success
Master Class 11 Business Studies: Engaging Questions & Answers for Success
Master Class 11 Economics: Engaging Questions & Answers for Success
Master Class 11 English: Engaging Questions & Answers for Success
Master Class 11 Maths: Engaging Questions & Answers for Success
Master Class 11 Biology: Engaging Questions & Answers for Success
Trending doubts
One Metric ton is equal to kg A 10000 B 1000 C 100 class 11 physics CBSE
There are 720 permutations of the digits 1 2 3 4 5 class 11 maths CBSE
Discuss the various forms of bacteria class 11 biology CBSE
Draw a diagram of a plant cell and label at least eight class 11 biology CBSE
State the laws of reflection of light
Explain zero factorial class 11 maths CBSE