


Which of the following options only correctly represents a thermodynamic process that is used as a correction in the determination of the speed of sound in an ideal gas?
Column $ 1 $ Column $ 2 $ Column $ 3 $ $ (i){W_{1 \to 2}} = \dfrac{1}{{\gamma - 1}}({P_2}{V_2} - {P_1}{V_1}) $ $ (i)Isothermal $ (P)
$ (ii){W_{1 \to 2}} = - P{V_2} + P{V_1}) $ $ (ii)Isochoric $ (Q)
$ (iii){W_{1 \to 2}} = 0 $ $ (iii)Isobaric $ (R)
$ (iv){W_{1 \to 2}} = - nRT\ln (\dfrac{{{V_1}}}{{{V_2}}}) $ $ (iv)Adiabatic $ (S)
(A).(I)(ii)(Q)
(B).(I)(iv)(Q)
(C).(IV)(ii)(R)
(D).(III)(iv)(R)
| Column $ 1 $ | Column $ 2 $ | Column $ 3 $ |
| $ (i){W_{1 \to 2}} = \dfrac{1}{{\gamma - 1}}({P_2}{V_2} - {P_1}{V_1}) $ | $ (i)Isothermal $ | (P)
|
| $ (ii){W_{1 \to 2}} = - P{V_2} + P{V_1}) $ | $ (ii)Isochoric $ | (Q)
|
| $ (iii){W_{1 \to 2}} = 0 $ | $ (iii)Isobaric $ | (R)
|
| $ (iv){W_{1 \to 2}} = - nRT\ln (\dfrac{{{V_1}}}{{{V_2}}}) $ | $ (iv)Adiabatic $ | (S)
|
Answer
541.2k+ views
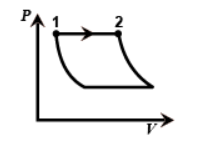
Hint :Now coming on the figure we can see that the first one is the graph of an Isobaric process since pressure is constant throughout from one to two.
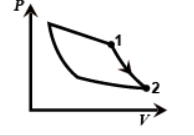
In the second one work done is adiabatic as pressure is decreasing rapidly from one to two. So this figure gives us an adiabatic process.
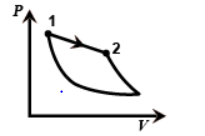
In the third figure the volume is decreasing from one to two so it is an Isothermal process.
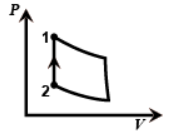
And in the last figure the volume is constant from two to one so this is the isochoric process as work done will be zero.
Complete Step By Step Answer:
In the given question we know that work done for adiabatic process is:
$ {W_{1 \to 2}} = \dfrac{1}{{\gamma - 1}}({P_2}{V_2} - {P_1}{V_1}) $
For work to be done by isobaric process:
$ {W_{1 \to 2}} = - P{V_2} + P{V_1} $
Now work done by isochoric process:
$ {W_{1 \to 2}} = 0 $ . Since the volume is constant throughout the whole process so the work done will be zero.
And last work done by isothermal:
$ {W_{1 \to 2}} = - nRT\ln (\dfrac{{{V_1}}}{{{V_2}}}) $
So if we combine the column first and column second, we get;
$ (i) $ $ (iv) $
In the options. That is adiabatic process.
Now coming on the figure we can see that the first one is the graph of an Isobaric process since pressure is constant throughout from one to two.
In the second one work done is adiabatic as pressure is decreasing rapidly from one to two. So this figure gives us an adiabatic process.
In the third figure the volume is decreasing from one to two so it is an Isothermal process.
And in the last figure the volume is constant from two to one so this is the isochoric process as work done will be zero.
So in the given question we see that the column one and two would match to the second figure of the column third.
So option B is the correct answer.
Note :
Basically in an isochoric process that is sometimes also called a constant-volume process, is a type of thermodynamic process in which volume is constant throughout the process. This is a type of quasi-static- process.
For an adiabatic process that occurs without the transfer of heat.
In the second one work done is adiabatic as pressure is decreasing rapidly from one to two. So this figure gives us an adiabatic process.
In the third figure the volume is decreasing from one to two so it is an Isothermal process.
And in the last figure the volume is constant from two to one so this is the isochoric process as work done will be zero.
Complete Step By Step Answer:
In the given question we know that work done for adiabatic process is:
$ {W_{1 \to 2}} = \dfrac{1}{{\gamma - 1}}({P_2}{V_2} - {P_1}{V_1}) $
For work to be done by isobaric process:
$ {W_{1 \to 2}} = - P{V_2} + P{V_1} $
Now work done by isochoric process:
$ {W_{1 \to 2}} = 0 $ . Since the volume is constant throughout the whole process so the work done will be zero.
And last work done by isothermal:
$ {W_{1 \to 2}} = - nRT\ln (\dfrac{{{V_1}}}{{{V_2}}}) $
So if we combine the column first and column second, we get;
$ (i) $ $ (iv) $
In the options. That is adiabatic process.
Now coming on the figure we can see that the first one is the graph of an Isobaric process since pressure is constant throughout from one to two.
In the second one work done is adiabatic as pressure is decreasing rapidly from one to two. So this figure gives us an adiabatic process.
In the third figure the volume is decreasing from one to two so it is an Isothermal process.
And in the last figure the volume is constant from two to one so this is the isochoric process as work done will be zero.
So in the given question we see that the column one and two would match to the second figure of the column third.
So option B is the correct answer.
Note :
Basically in an isochoric process that is sometimes also called a constant-volume process, is a type of thermodynamic process in which volume is constant throughout the process. This is a type of quasi-static- process.
For an adiabatic process that occurs without the transfer of heat.
Recently Updated Pages
Master Class 11 Computer Science: Engaging Questions & Answers for Success
Master Class 11 Business Studies: Engaging Questions & Answers for Success
Master Class 11 Economics: Engaging Questions & Answers for Success
Master Class 11 English: Engaging Questions & Answers for Success
Master Class 11 Maths: Engaging Questions & Answers for Success
Master Class 11 Biology: Engaging Questions & Answers for Success
Trending doubts
One Metric ton is equal to kg A 10000 B 1000 C 100 class 11 physics CBSE
There are 720 permutations of the digits 1 2 3 4 5 class 11 maths CBSE
Discuss the various forms of bacteria class 11 biology CBSE
Draw a diagram of a plant cell and label at least eight class 11 biology CBSE
State the laws of reflection of light
Explain zero factorial class 11 maths CBSE