


Which of the following levels represents the solid phase of the substance?
(A) Level A
(B) Level B
(C) Level C
(D) Level D
(E) Level E
Answer
478.5k+ views
Hint: A phase diagram is a graphical representation of a substance's physical states under various temperature and pressure circumstances. Pressure is on the x-axis and temperature is on the y-axis in this phase diagram. A phase change occurs when we cross the lines or curves on the phase diagram. Furthermore, on the lines or curves, two states of the substance coexist in equilibrium.
Complete answer:
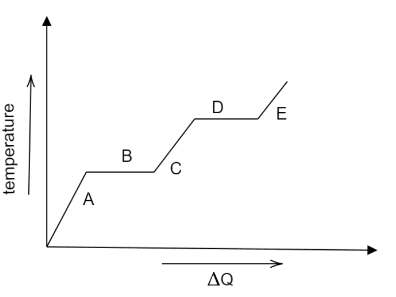
When heat is provided to a substance, its temperature rises and follows the level A. however, as more heat is given to the substance, its temperature does not rise as much since it is (level B) a change of state of substance, similar to how level D demonstrates change of state. We know that when heat is applied to a substance, the order of state change is solid to liquid, liquid to gas, thus level A will represent the solid phase, level C and level E will represent the liquid and the gaseous phase respectively.
Hence option A) level A is the correct option.
Note:
Pressure is on the x-axis and temperature is on the y-axis in a typical phase diagram. As you move around the phase diagram, you'll learn more about the many phases of matter. The relative densities of the phases are revealed by moving along a constant temperature line. The relative energy of the phases are shown by moving along a constant pressure line.
Complete answer:
When heat is provided to a substance, its temperature rises and follows the level A. however, as more heat is given to the substance, its temperature does not rise as much since it is (level B) a change of state of substance, similar to how level D demonstrates change of state. We know that when heat is applied to a substance, the order of state change is solid to liquid, liquid to gas, thus level A will represent the solid phase, level C and level E will represent the liquid and the gaseous phase respectively.
Hence option A) level A is the correct option.
Note:
Pressure is on the x-axis and temperature is on the y-axis in a typical phase diagram. As you move around the phase diagram, you'll learn more about the many phases of matter. The relative densities of the phases are revealed by moving along a constant temperature line. The relative energy of the phases are shown by moving along a constant pressure line.
Recently Updated Pages
Master Class 11 Computer Science: Engaging Questions & Answers for Success
Master Class 11 Business Studies: Engaging Questions & Answers for Success
Master Class 11 Economics: Engaging Questions & Answers for Success
Master Class 11 English: Engaging Questions & Answers for Success
Master Class 11 Maths: Engaging Questions & Answers for Success
Master Class 11 Biology: Engaging Questions & Answers for Success
Trending doubts
One Metric ton is equal to kg A 10000 B 1000 C 100 class 11 physics CBSE
There are 720 permutations of the digits 1 2 3 4 5 class 11 maths CBSE
Discuss the various forms of bacteria class 11 biology CBSE
Draw a diagram of a plant cell and label at least eight class 11 biology CBSE
State the laws of reflection of light
Explain zero factorial class 11 maths CBSE