


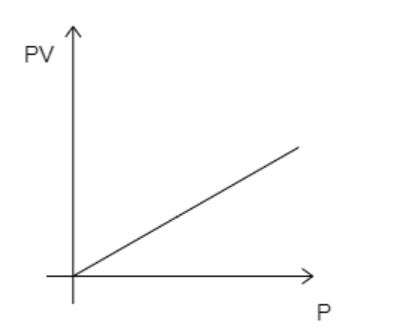
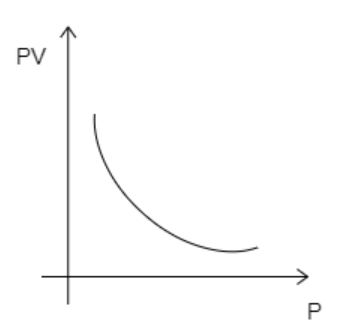
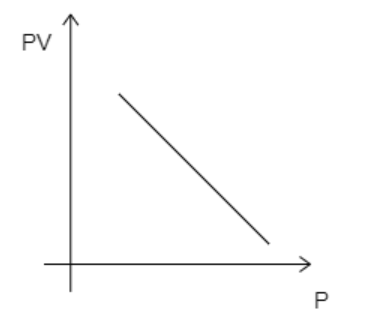
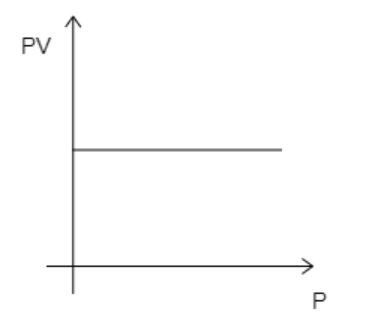
Which of the following graphs represent the correct graph between Pv and P of one mole of gas at constant temperature?
A)
B)
C)
D)
Answer
612.3k+ views
Hint:The ideal gas equation describes an empirical relation between the pressure of a gas, its volume, the temperature of the gas and the number of moles present in the given sample of gas. According to the ideal gas equation, $PV$ remains constant if the temperature remains fixed.
Formula used:
-The ideal gas equation is given by, $PV = nRT$ where $P$ is the pressure of the gas, $V$ is the volume of the gas, $n$ is the number of moles present in the gas sample, $R$ is the gas constant and $T$ is the temperature.
Complete step by step answer.
Step 1: Describe the features of the required graph.
The required graph is drawn with pressure $P$ along its X-axis and $PV$ along its Y-axis. The graph is obtained at a constant temperature for one mole of gas.
The ideal gas equation is given by, $PV = nRT$ --------- (1)
where $P$ is the pressure of the gas, $V$ is the volume of the gas, $n$ is the number of moles present in the gas sample, $R$ is the gas constant and $T$ is the temperature.
Here, the number of moles, $n = 1$ . Now, if the temperature is kept constant, then all the variables on the left-hand side of equation (1) will be constant. This then implies that $PV$ remains constant. So, even if pressure is increased, $PV$ will remain constant. This suggests that the graph must be a straight line parallel to the X-axis. The correct graph will take the form given below.
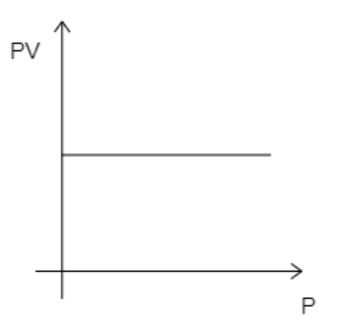
While analyzing the given graphs we see that graph 4 matches our description.
Hence, the correct option is D.
Additional information: The relationship depicted by $PV = {\text{constant}}$ for constant temperature is referred to as Boyle’s law.
Note: When the temperature is kept constant and if pressure is increased we saw that $PV$ does not change. This is because as the pressure increases the volume of the gas decreases and thereby nullifies any change in $PV$.
Formula used:
-The ideal gas equation is given by, $PV = nRT$ where $P$ is the pressure of the gas, $V$ is the volume of the gas, $n$ is the number of moles present in the gas sample, $R$ is the gas constant and $T$ is the temperature.
Complete step by step answer.
Step 1: Describe the features of the required graph.
The required graph is drawn with pressure $P$ along its X-axis and $PV$ along its Y-axis. The graph is obtained at a constant temperature for one mole of gas.
The ideal gas equation is given by, $PV = nRT$ --------- (1)
where $P$ is the pressure of the gas, $V$ is the volume of the gas, $n$ is the number of moles present in the gas sample, $R$ is the gas constant and $T$ is the temperature.
Here, the number of moles, $n = 1$ . Now, if the temperature is kept constant, then all the variables on the left-hand side of equation (1) will be constant. This then implies that $PV$ remains constant. So, even if pressure is increased, $PV$ will remain constant. This suggests that the graph must be a straight line parallel to the X-axis. The correct graph will take the form given below.
While analyzing the given graphs we see that graph 4 matches our description.
Hence, the correct option is D.
Additional information: The relationship depicted by $PV = {\text{constant}}$ for constant temperature is referred to as Boyle’s law.
Note: When the temperature is kept constant and if pressure is increased we saw that $PV$ does not change. This is because as the pressure increases the volume of the gas decreases and thereby nullifies any change in $PV$.
Recently Updated Pages
Master Class 12 Economics: Engaging Questions & Answers for Success
Master Class 12 English: Engaging Questions & Answers for Success
Master Class 12 Social Science: Engaging Questions & Answers for Success
Master Class 12 Maths: Engaging Questions & Answers for Success
Master Class 12 Physics: Engaging Questions & Answers for Success
Master Class 9 General Knowledge: Engaging Questions & Answers for Success
Trending doubts
One Metric ton is equal to kg A 10000 B 1000 C 100 class 11 physics CBSE
Difference Between Prokaryotic Cells and Eukaryotic Cells
Two of the body parts which do not appear in MRI are class 11 biology CBSE
1 ton equals to A 100 kg B 1000 kg C 10 kg D 10000 class 11 physics CBSE
10 examples of friction in our daily life
DNA is not present in A Nucleus B Mitochondria C Chloroplast class 11 biology CBSE