


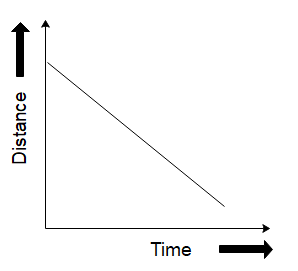
Which of the following graphs does not represent constant speed?
(A)
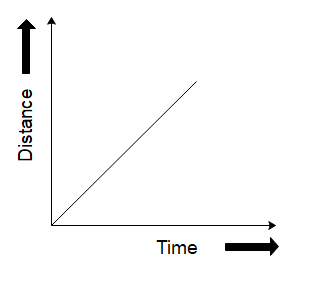
(B)
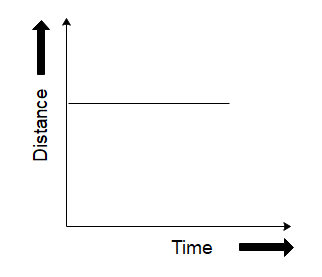
(C)
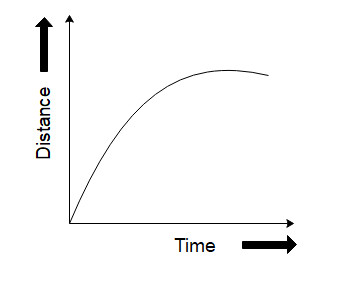
(D)
Answer
603.9k+ views
Hint: The speed of an object is the ratio of the distance travelled by the object and the time it takes to cover that distance. For a graph, a constant speed is represented by a straight line in a distance versus time graph.
Complete answer
We want to find out the graph which does not represent constant speed. Let us start by determining what a graph for constant speed would look like.
We know that the speed of an object is calculated as the ratio of the distance travelled by the object to the time it takes to travel that distance. For e.g., if a car is traveling at a speed of $ 10\,m/s $ , it will cover a distance of 10 metres in one second, 20 metres in 2 seconds, and so on and forth. If we were to plot the distance travelled by the car versus time, it would be a straight line since the car covers equal distances in equal amounts of time.
So now that we know that constant speeds are represented by straight lines in the graph of distance versus time, we can see that the graph in option (D) is not a straight line. So, it is the correct choice as it does not represent constant speed. This can also be thought of like the curve having different slopes at different points of its trajectory which means the object will have different velocities at different points hence it is not constant.
Therefore the correct answer will be option D.
Note:
The equation of speed, distance, and time can also provide us the answer here. We know that
$ v = \dfrac{d}{t} $ . We can rewrite this as $ d = vt $ . Since the velocity is constant, this equation is similar to $ y = mx $ which is the equation of a line passing through the origin. Hence if the distance is plotted on the y-axis and time is plotted on the x-axis, we will obtain a straight line whose slope will give us the velocity of the object.
Recently Updated Pages
Master Class 11 English: Engaging Questions & Answers for Success
Master Class 11 Social Science: Engaging Questions & Answers for Success
Master Class 11 Maths: Engaging Questions & Answers for Success
Master Class 11 Biology: Engaging Questions & Answers for Success
Master Class 11 Physics: Engaging Questions & Answers for Success
Master Class 11 Chemistry: Engaging Questions & Answers for Success
Trending doubts
One Metric ton is equal to kg A 10000 B 1000 C 100 class 11 physics CBSE
Difference Between Prokaryotic Cells and Eukaryotic Cells
Find the value of the expression given below sin 30circ class 11 maths CBSE
Difference between physical and chemical change class 11 chemistry CBSE
Two of the body parts which do not appear in MRI are class 11 biology CBSE
Draw a diagram of a plant cell and label at least eight class 11 biology CBSE