


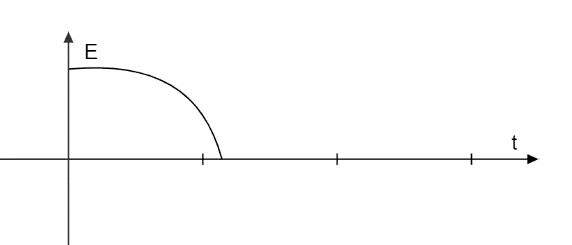
Which of the following energy-time graphs represents a damped harmonic oscillator?
(A)

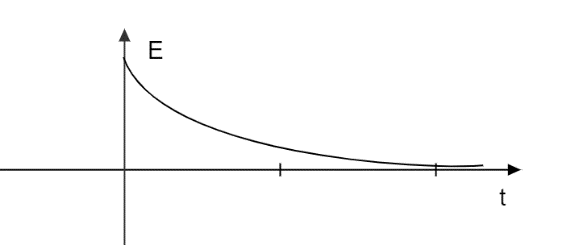
(B)
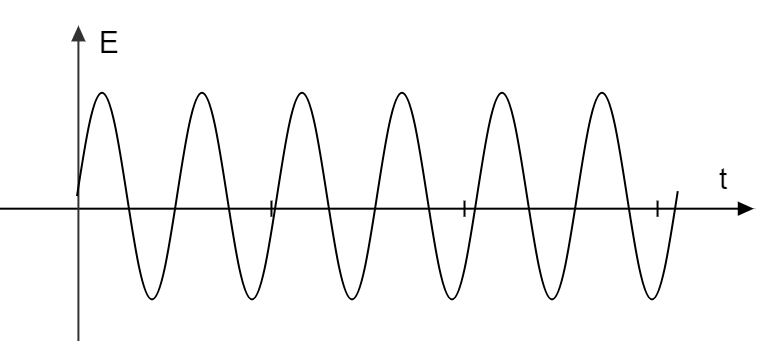
(C)
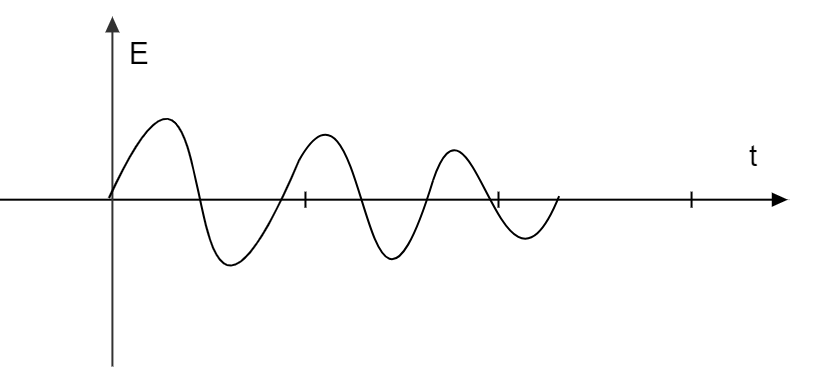
(D)
Answer
573.6k+ views
Hint: To solve this question we will first understand the meaning and significance of harmonic oscillators. A harmonic oscillator is considered as a physical system in which some values or quantities oscillate to and fro or above and below from a mean value at one or more than one characteristic frequencies.
Complete Step-by-step solution
A harmonic oscillator is very important and shows significant properties because it provides an approximate solution of nearly every system with minimum potential energy which is considered as harmonic oscillator potential. A simple example of a harmonic oscillator is a simple pendulum. Small clocks and radio circuits also work on the principle of the harmonic oscillator.
Now we will discuss the damped harmonic oscillator which can be defined as a vibrating system in which the amplitudes of the vibrations decrease over time. If we observe then we can find that nearly every physical system act as a damped harmonic oscillator.
As discussed, in the case of the damped harmonic oscillator the amplitude of the oscillations reduces over time. Hence if we observe the energy-time graph of the damped harmonic oscillator it can be seen that as time passes then the energy of the system reduces.
Therefore from the given options, the only valid option that matches is an option (A).
Hence the option (A) is the correct answer.
Note
We can observe examples of the damped harmonic oscillator in our day to day life such as a YO-YO, clock pendulum, and guitar strings. In the case of all these examples, it can be seen that oscillations tend to slow down over time.
Recently Updated Pages
Basicity of sulphurous acid and sulphuric acid are
Master Class 11 Business Studies: Engaging Questions & Answers for Success
Master Class 11 Computer Science: Engaging Questions & Answers for Success
Master Class 11 Economics: Engaging Questions & Answers for Success
Master Class 11 Social Science: Engaging Questions & Answers for Success
Master Class 11 English: Engaging Questions & Answers for Success
Trending doubts
One Metric ton is equal to kg A 10000 B 1000 C 100 class 11 physics CBSE
Explain zero factorial class 11 maths CBSE
State and prove Bernoullis theorem class 11 physics CBSE
What steps did the French revolutionaries take to create class 11 social science CBSE
The transition element that has lowest enthalpy of class 11 chemistry CBSE
Can anyone list 10 advantages and disadvantages of friction