


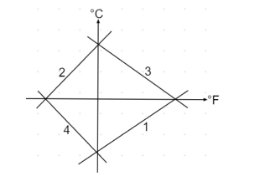
Which of the curves in the figure represents the relation between Celsius and Fahrenheit temperature?
${\text{A}}{\text{.}}$ 1
${\text{B}}{\text{.}}$ 2
${\text{C}}{\text{.}}$ 3
${\text{D}}{\text{.}}$ 4
Answer
549.6k+ views
Hint: Here, we will proceed by writing down the mathematical relation between Celsius and Fahrenheit temperature scales. Then, compare this equation with the general equation of a straight line.
Formula used:
${\text{F}} = \dfrac{9}{5} \times {\text{C}} + 32$ and y = mx+c.
Complete answer:
According to the mathematical relation between Celsius and Fahrenheit temperature scales, we have
${\text{F}} = \dfrac{9}{5} \times {\text{C}} + 32{\text{ }} \to {\text{(1)}}$
As we know that the general equation of any straight line is given by
y = mx+c $ \to {\text{(2)}}$ where m denotes the slope of the straight line and c denotes the intercept of the straight line on the y-axis
Since, in the given figure it is clear that x-axis corresponds to the Fahrenheit temperature scale and the y-axis corresponds to the Celsius temperature scale
By rearranging the equation (1), we get
$
\Rightarrow {\text{F}} - 32 = \dfrac{9}{5} \times {\text{C}} \\
\Rightarrow {\text{C}} = \dfrac{5}{9} \times \left( {{\text{F}} - 32} \right) \\
\Rightarrow {\text{C}} = \left( {\dfrac{5}{9}} \right){\text{F}} - \dfrac{5}{9} \times 32 \\
\Rightarrow {\text{C}} = \left( {\dfrac{5}{9}} \right){\text{F}} - \dfrac{{160}}{9}{\text{ }} \to {\text{(3)}} \\
$
By comparing equation (2) with equation (3), we can say that the relation between the Celsius and Fahrenheit temperature is a straight line having a slope of $\dfrac{5}{9}$ and y-intercept as $ - \dfrac{{160}}{9}$. This means that the straight line representing the relation between the Celsius and Fahrenheit temperature has a positive slope and negative intercept.
Therefore, the required curve representing the relation between the Celsius and Fahrenheit is curve 1 which is lying in the fourth quadrant.
So, the correct answer is “Option A”.
Note:
In this particular problem, it is important to know the various characteristics of the straight lines lying in the figure given. The curve 1 lying in the fourth quadrant have positive slope and negative intercept, the curve 2 lying in the second quadrant have positive slope and positive intercept, the curve 3 lying in the first quadrant have negative slope and positive intercept and the curve 4 lying in the third quadrant have negative slope and negative intercept.
Recently Updated Pages
Master Class 11 Social Science: Engaging Questions & Answers for Success
Master Class 11 Chemistry: Engaging Questions & Answers for Success
Master Class 12 Business Studies: Engaging Questions & Answers for Success
Master Class 12 Chemistry: Engaging Questions & Answers for Success
Master Class 12 Biology: Engaging Questions & Answers for Success
Class 12 Question and Answer - Your Ultimate Solutions Guide
Trending doubts
What is the situation called when no party gets the class 9 social science CBSE
Find the sum of series 1 + 2 + 3 + 4 + 5 + + 100 class 9 maths CBSE
Fill the blanks with the suitable prepositions 1 The class 9 english CBSE
Difference Between Plant Cell and Animal Cell
What is pollution? How many types of pollution? Define it
Name 10 Living and Non living things class 9 biology CBSE