




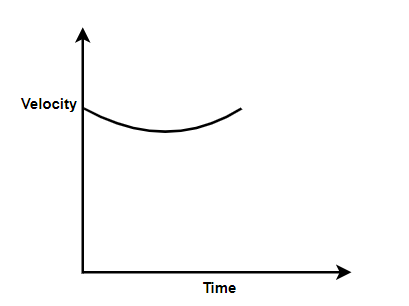
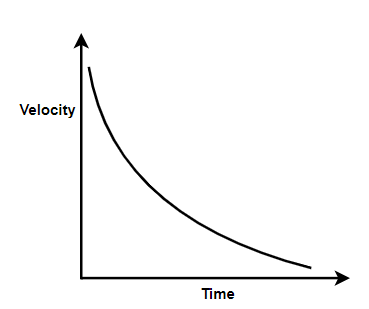
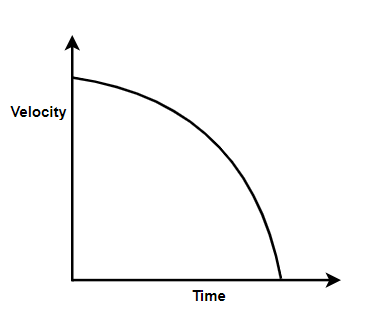
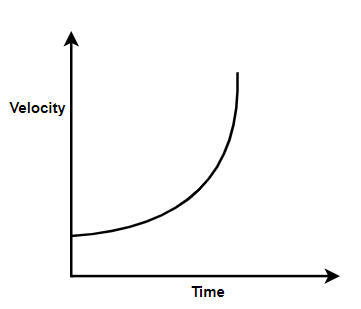
Which graph corresponds to an object moving with a constant negative acceleration and a positive velocity?
$\left( a \right)$
$\left( b \right)$
$\left( c \right)$
$\left( d \right)$
Answer
 Verified
608.1k+ views
Hint: We are asked to find a graph out of the four given graphs which represents negative acceleration and positive velocity. Thus, we will use our concepts of acceleration, velocity and broadly of motion. Then we will use the ideas of integration and differentiation for picking out the graph.
Complete Step by Step Solution:
Given the case as negative acceleration.
Thus,
Let us take acceleration to be a negative constant.
$ \Rightarrow a = - A$
Now,
We know $a = \dfrac{{dv}}{{dt}}$.
Thus, we get
$ \Rightarrow \dfrac{{dv}}{{dt}} = - A$
We can write $\dfrac{{dv}}{{dt}} = \dfrac{{dx}}{{dt}} \times \dfrac{{dv}}{{dx}}$
Thus, we get
$ \Rightarrow \dfrac{{dx}}{{dt}} \times \dfrac{{dv}}{{dx}} = - A$
But, $\dfrac{{dx}}{{dt}} = v$
Thus, we get
$ \Rightarrow v\dfrac{{dv}}{{dx}} = - A$
Now,
Rearranging the terms, we get
$ \Rightarrow vdv = - Adx$
Now,
Integrating both sides with limits of velocity being $0 - v$ and the limits of distance being $0 - x$.
Integrating under these limits, we get
$ \Rightarrow \int_0^v {vdv = \int_0^x {dx} } $
After integration, we get
\[ \Rightarrow \mathop {\left| {\dfrac{{{v^2}}}{2}} \right|}\nolimits_0^v = - A\mathop {\left| x \right|}\nolimits_0^x + C\]
Where,
$C$ , is the constant of integration.
After putting the limits, we get
$ \Rightarrow \dfrac{{{v^2}}}{2} = - Ax + C$
Taking the whole equation equating to distance, we get
$ \Rightarrow x = \,\,\dfrac{{ - {v^2}}}{{2A}} + \dfrac{C}{A}$
Clearly, for this we will get a graph as a velocity-distance graph with velocity curving down with increase in distance.
Hence, we can see that out of the four options, $\left( c \right)$ is showing us the correct graph.
Additional Information:
For depicting the parts of calculus in a graph, there are two cases.
First case is, we depict the differentiation of a quantity as the slope of the graph.
For example:
If distance is differentiated with respect to time, then we plot distance on the y-axis and time on the x-axis and the slope of the plotted graph shows the value $\dfrac{{ds}}{{dt}}$ , where $s$ is the distance and $t$ is the time.
Then,
The integration of a value is depicted by the area under the curve of the graph.
For example:
If velocity is integrated with respect to time, then we plot velocity on the y-axis and time on the x-axis and the area of the plotted curve shows the value $\int {vdt} $ , where $v$ is the velocity and $t$ is the time.
Note: In this case, we took acceleration as a constant quantity and thus we found out this result. If the acceleration was itself a changing quantity, then the result of integration would be somewhat different and as a result, the graph would also change.
Complete Step by Step Solution:
Given the case as negative acceleration.
Thus,
Let us take acceleration to be a negative constant.
$ \Rightarrow a = - A$
Now,
We know $a = \dfrac{{dv}}{{dt}}$.
Thus, we get
$ \Rightarrow \dfrac{{dv}}{{dt}} = - A$
We can write $\dfrac{{dv}}{{dt}} = \dfrac{{dx}}{{dt}} \times \dfrac{{dv}}{{dx}}$
Thus, we get
$ \Rightarrow \dfrac{{dx}}{{dt}} \times \dfrac{{dv}}{{dx}} = - A$
But, $\dfrac{{dx}}{{dt}} = v$
Thus, we get
$ \Rightarrow v\dfrac{{dv}}{{dx}} = - A$
Now,
Rearranging the terms, we get
$ \Rightarrow vdv = - Adx$
Now,
Integrating both sides with limits of velocity being $0 - v$ and the limits of distance being $0 - x$.
Integrating under these limits, we get
$ \Rightarrow \int_0^v {vdv = \int_0^x {dx} } $
After integration, we get
\[ \Rightarrow \mathop {\left| {\dfrac{{{v^2}}}{2}} \right|}\nolimits_0^v = - A\mathop {\left| x \right|}\nolimits_0^x + C\]
Where,
$C$ , is the constant of integration.
After putting the limits, we get
$ \Rightarrow \dfrac{{{v^2}}}{2} = - Ax + C$
Taking the whole equation equating to distance, we get
$ \Rightarrow x = \,\,\dfrac{{ - {v^2}}}{{2A}} + \dfrac{C}{A}$
Clearly, for this we will get a graph as a velocity-distance graph with velocity curving down with increase in distance.
Hence, we can see that out of the four options, $\left( c \right)$ is showing us the correct graph.
Additional Information:
For depicting the parts of calculus in a graph, there are two cases.
First case is, we depict the differentiation of a quantity as the slope of the graph.
For example:
If distance is differentiated with respect to time, then we plot distance on the y-axis and time on the x-axis and the slope of the plotted graph shows the value $\dfrac{{ds}}{{dt}}$ , where $s$ is the distance and $t$ is the time.
Then,
The integration of a value is depicted by the area under the curve of the graph.
For example:
If velocity is integrated with respect to time, then we plot velocity on the y-axis and time on the x-axis and the area of the plotted curve shows the value $\int {vdt} $ , where $v$ is the velocity and $t$ is the time.
Note: In this case, we took acceleration as a constant quantity and thus we found out this result. If the acceleration was itself a changing quantity, then the result of integration would be somewhat different and as a result, the graph would also change.
Recently Updated Pages
Which will be the least stable resonating structure class 11 chemistry CBSE

How many 5 digit telephone numbers can be construc-class-11-maths-CBSE
How do you find the angle of the resultant vector class 11 physics CBSE
Draw labelled diagram of the following i Gram seed class 11 biology CBSE
What is the need and importance of classification class 11 biology CBSE
The way in which the sparrows expressed their sorrow class 11 english CBSE
Trending doubts
One Metric ton is equal to kg A 10000 B 1000 C 100 class 11 physics CBSE
Find the value of the expression given below sin 30circ class 11 maths CBSE
1 Quintal is equal to a 110 kg b 10 kg c 100kg d 1000 class 11 physics CBSE
Draw a diagram of nephron and explain its structur class 11 biology CBSE
10 examples of friction in our daily life
Proton was discovered by A Thomson B Rutherford C Chadwick class 11 chemistry CBSE