


What is the graph of \[f\left( x \right) = {x^2}\]?
Answer
558.9k+ views
Hint: Here in this question, we have to plot the graph of the given equation. Firstly, rewrite \[f\left( x \right) = y\] in LHS, next we have to give the values to the x like 0, 1, 2, 3, … simultaneously we get the values of y. Now we get the coordinates of the given equation i.e., \[\left( {x,y} \right)\] like this, we assign the value of x and we determine the value of y and we plot the graph.
Complete step by step solution:
Given an equation in the form of an algebraic equation having variables x.
Consider the equation \[f\left( x \right) = {x^2}\]
Replace \[f\left( x \right) = y\] in LHS, then
\[ \Rightarrow \,\,y = {x^2}\]
Now, By giving the x values 0, 1, 2, 3, … simultaneously we get the values of y
Put x=0
Then \[ \Rightarrow \,y = {0^2}\]
\[\therefore y = 0\]
Therefore, co-ordinate \[\left( {x,y} \right) = \left( {0,0} \right)\]
Put x=1
\[ \Rightarrow \,y = {1^2}\]
\[\therefore y = 1\]
Therefore, co-ordinate \[\left( {x,y} \right) = \left( {1,1} \right)\]
Put x=2
\[ \Rightarrow \,y = {2^2}\]
\[\therefore y = 4\]
Therefore, co-ordinate \[\left( {x,y} \right) = \left( {2,4} \right)\]
Put x=3
\[ \Rightarrow \,y = {3^2}\]
\[\therefore y = 9\]
Therefore, co-ordinate \[\left( {x,y} \right) = \left( {3,9} \right)\]
And so on
The same holds true for negative x-values to the left of the y-axis since a negative value squared is positive. For example,
Put x=-1
\[ \Rightarrow \,y = {\left( { - 1} \right)^2}\]
\[\therefore y = 1\]
Therefore, co-ordinate \[\left( {x,y} \right) = \left( { - 1,1} \right)\]
Put x=-2
\[ \Rightarrow \,y = {\left( { - 2} \right)^2}\]
\[\therefore y = 4\]
Therefore, co-ordinate \[\left( {x,y} \right) = \left( { - 2,4} \right)\]
Put x=-3
\[ \Rightarrow \,y = {\left( { - 3} \right)^2}\]
\[\therefore y = 9\]
Therefore, co-ordinate \[\left( {x,y} \right) = \left( { - 3,9} \right)\]
And so on
The coordinates can be written in table as :
Now, the graph of the given linear equation \[f\left( x \right) = {x^2}\] by using the above table as follows:
The graph of \[f\left( x \right) = {x^2}\] it looks like a Parabola.
Note: The graph is plotted x-axis versus y axis. The graph is two dimensional. By the given equation write it for y and consider it as a graph equation. By the equation of a graph, we can plot the graph by assuming the value of x. we can’t assume the value of y. because the value of y depends on the value of x. Hence, we have plotted the graph.
Complete step by step solution:
Given an equation in the form of an algebraic equation having variables x.
Consider the equation \[f\left( x \right) = {x^2}\]
Replace \[f\left( x \right) = y\] in LHS, then
\[ \Rightarrow \,\,y = {x^2}\]
Now, By giving the x values 0, 1, 2, 3, … simultaneously we get the values of y
Put x=0
Then \[ \Rightarrow \,y = {0^2}\]
\[\therefore y = 0\]
Therefore, co-ordinate \[\left( {x,y} \right) = \left( {0,0} \right)\]
Put x=1
\[ \Rightarrow \,y = {1^2}\]
\[\therefore y = 1\]
Therefore, co-ordinate \[\left( {x,y} \right) = \left( {1,1} \right)\]
Put x=2
\[ \Rightarrow \,y = {2^2}\]
\[\therefore y = 4\]
Therefore, co-ordinate \[\left( {x,y} \right) = \left( {2,4} \right)\]
Put x=3
\[ \Rightarrow \,y = {3^2}\]
\[\therefore y = 9\]
Therefore, co-ordinate \[\left( {x,y} \right) = \left( {3,9} \right)\]
And so on
The same holds true for negative x-values to the left of the y-axis since a negative value squared is positive. For example,
Put x=-1
\[ \Rightarrow \,y = {\left( { - 1} \right)^2}\]
\[\therefore y = 1\]
Therefore, co-ordinate \[\left( {x,y} \right) = \left( { - 1,1} \right)\]
Put x=-2
\[ \Rightarrow \,y = {\left( { - 2} \right)^2}\]
\[\therefore y = 4\]
Therefore, co-ordinate \[\left( {x,y} \right) = \left( { - 2,4} \right)\]
Put x=-3
\[ \Rightarrow \,y = {\left( { - 3} \right)^2}\]
\[\therefore y = 9\]
Therefore, co-ordinate \[\left( {x,y} \right) = \left( { - 3,9} \right)\]
And so on
The coordinates can be written in table as :
| \[x\] | \[ - 3\] | \[ - 2\] | \[ - 1\] | \[0\] | \[1\] | \[2\] | \[3\] |
| \[f\left( x \right) = y\] | \[9\] | \[4\] | \[1\] | \[0\] | \[1\] | \[4\] | \[9\] |
| \[\left( {x,y} \right)\] | \[\left( { - 3,9} \right)\] | \[\left( { - 2,4} \right)\] | \[\left( { - 1,1} \right)\] | \[\left( {0,0} \right)\] | \[\left( {1,1} \right)\] | \[\left( {2,4} \right)\] | \[\left( {3,9} \right)\] |
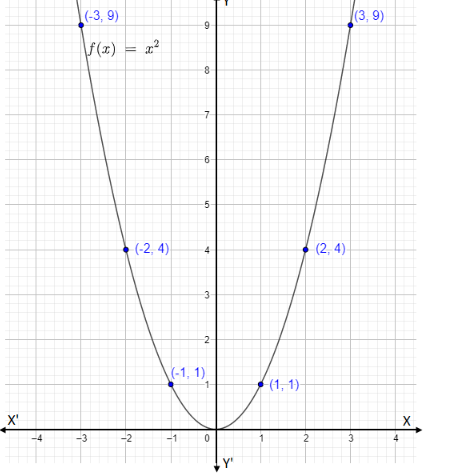
Now, the graph of the given linear equation \[f\left( x \right) = {x^2}\] by using the above table as follows:
The graph of \[f\left( x \right) = {x^2}\] it looks like a Parabola.
Note: The graph is plotted x-axis versus y axis. The graph is two dimensional. By the given equation write it for y and consider it as a graph equation. By the equation of a graph, we can plot the graph by assuming the value of x. we can’t assume the value of y. because the value of y depends on the value of x. Hence, we have plotted the graph.

Recently Updated Pages
Master Class 8 English: Engaging Questions & Answers for Success
Master Class 8 Science: Engaging Questions & Answers for Success
Master Class 8 Maths: Engaging Questions & Answers for Success
Class 8 Question and Answer - Your Ultimate Solutions Guide
Master Class 8 Social Science: Engaging Questions & Answers for Success
Master Class 12 Economics: Engaging Questions & Answers for Success
Trending doubts
What is BLO What is the full form of BLO class 8 social science CBSE
Citizens of India can vote at the age of A 18 years class 8 social science CBSE
Right to vote is a AFundamental Right BFundamental class 8 social science CBSE
Give me the opposite gender of Duck class 8 english CBSE
Full form of STD, ISD and PCO
Explain land use pattern in India and why has the land class 8 social science CBSE