


What is a PV indicator diagram?
Answer
536.1k+ views
Hint: In order to solve this question we need to understand the PV indicator diagram. PV indicator diagram is a graph between the pressure and volume of a system. PV indicator is commonly used in thermodynamics, cardiovascular physiology, and respiratory physiology. The p-v diagram is originally called indicator diagram.
Complete answer:
Indicator diagram (P-V diagram) A curve showing variation of volume of a substance taken along the X-axis and the variation of pressure taken along Y-axis is called an indicator diagram or P-V diagram. The shape of the indicator diagram shall depend on the nature of the thermodynamic process the system undergoes.
A curve showing variation of volume of a substance taken along the X-axis and the variation of pressure taken along Y-axis is called an indicator diagram or P-V diagram. The shape of the indicator diagram shall depend on the nature of the thermodynamic process the system undergoes.
Let us consider one mole of an ideal gas enclosed in a cylinder fitted with a perfectly frictionless piston.
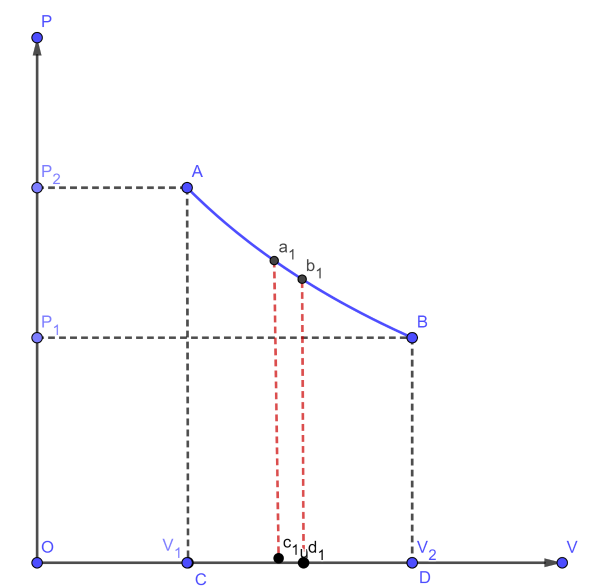
Let, $ {P_1}, $ $ {V_1} $ and T be the initial state of the gas. If dV is an infinitesimally small increase in volume of the gas during which the pressure P is assumed to be constant, then small amount of work done by the gas is $ dW = PdV $
In the indicator diagram,
$ dW = {\text{area }}{a_1}{b_1}{c_1}{d_1} $
The total work done by the gas during expansion from $ {V_1} $ and $ {V_2} $ is,
$ W = \int\limits_{{v_1}}^{{v_2}} {PdV} = {\text{ Area ABCD, in the indicator diagram}} $
Hence, in an indicator diagram the area under the curve represents the work done.
Note:
It should be remembered that the p-v diagram is originally called indicator diagram. The pressure and volume diagram are used to describe corresponding changes in a system. The pressure and volume diagram are used to estimate the net work performed by a thermodynamic cycle. The total area under the curve on a PV diagram, is we can find the work done by determining.
Complete answer:
Indicator diagram (P-V diagram) A curve showing variation of volume of a substance taken along the X-axis and the variation of pressure taken along Y-axis is called an indicator diagram or P-V diagram. The shape of the indicator diagram shall depend on the nature of the thermodynamic process the system undergoes.
A curve showing variation of volume of a substance taken along the X-axis and the variation of pressure taken along Y-axis is called an indicator diagram or P-V diagram. The shape of the indicator diagram shall depend on the nature of the thermodynamic process the system undergoes.
Let us consider one mole of an ideal gas enclosed in a cylinder fitted with a perfectly frictionless piston.
Let, $ {P_1}, $ $ {V_1} $ and T be the initial state of the gas. If dV is an infinitesimally small increase in volume of the gas during which the pressure P is assumed to be constant, then small amount of work done by the gas is $ dW = PdV $
In the indicator diagram,
$ dW = {\text{area }}{a_1}{b_1}{c_1}{d_1} $
The total work done by the gas during expansion from $ {V_1} $ and $ {V_2} $ is,
$ W = \int\limits_{{v_1}}^{{v_2}} {PdV} = {\text{ Area ABCD, in the indicator diagram}} $
Hence, in an indicator diagram the area under the curve represents the work done.
Note:
It should be remembered that the p-v diagram is originally called indicator diagram. The pressure and volume diagram are used to describe corresponding changes in a system. The pressure and volume diagram are used to estimate the net work performed by a thermodynamic cycle. The total area under the curve on a PV diagram, is we can find the work done by determining.
Recently Updated Pages
Master Class 11 English: Engaging Questions & Answers for Success
Master Class 11 Social Science: Engaging Questions & Answers for Success
Master Class 11 Maths: Engaging Questions & Answers for Success
Master Class 11 Biology: Engaging Questions & Answers for Success
Master Class 11 Physics: Engaging Questions & Answers for Success
Master Class 11 Chemistry: Engaging Questions & Answers for Success
Trending doubts
One Metric ton is equal to kg A 10000 B 1000 C 100 class 11 physics CBSE
Difference Between Prokaryotic Cells and Eukaryotic Cells
Two of the body parts which do not appear in MRI are class 11 biology CBSE
Find the value of the expression given below sin 30circ class 11 maths CBSE
Draw a diagram of a plant cell and label at least eight class 11 biology CBSE
10 examples of friction in our daily life