


What does sine curve mean?
Answer
537.9k+ views
Hint: Here you have to explain the graph of the sine curve and try explaining why the shape of it is the way it is. Explain the domain and range of the function and how that affects the curve and its characteristics and compare it to other curves such as cosine.
Complete step-by-step answer:
Sine Curve – Here is how the sine curve first looks like. It is represented by the equation \[y=\sin x\] .
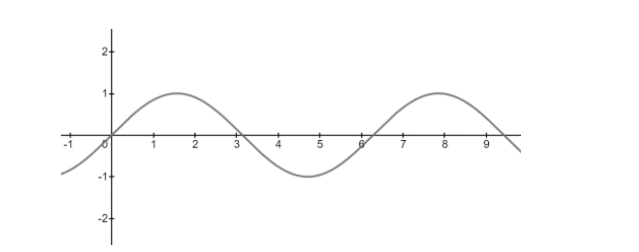
A sine curve is a function which always starts at \[0{}^\circ \] and is a periodic function which repeats itself after \[2\pi \] . This means that after \[2\pi \] it gives us the same value we got at \[0{}^\circ \] and it continues till the next \[2\pi \] part of the curve. The sin curve starts at \[0\] on the y axis and \[0{}^\circ \] on the x axis. It then continues till it reaches \[1\] on y axis when we are at \[90{}^\circ \] or \[\dfrac{\pi }{2}\] (as we can say in radians) on the x axis. After that sin curve starts decreasing again till we reach 0 on y axis while being at \[180{}^\circ \] or \[\pi \] on x axis. The function keeps decreasing until we reach \[-1\] on the y axis at \[\dfrac{3\pi }{2}\] on the x axis. After that the function starts increasing again till reaching \[0\] on y axis when being at \[2\pi \] at x axis. After \[2\pi \] the function is periodic which we can expressed as
\[\sin (\theta )=\sin (\theta +2\pi )\]
The sine function and cosine has the phase difference of \[\dfrac{\pi }{2}\] with each other the cosine function being \[\dfrac{\pi }{2}\] ahead when it comes in comparison to sine function. Both the graphs meet each other at \[\dfrac{\pi }{4}\] and \[\dfrac{5\pi }{4}\] .
Note: This graph of sine is used in technical analysis and when we trade we can use it to identify patterns and crossover when it comes to oscillators. Sine curves are also used to represent the oscillations of particles in physics.
Complete step-by-step answer:
Sine Curve – Here is how the sine curve first looks like. It is represented by the equation \[y=\sin x\] .
A sine curve is a function which always starts at \[0{}^\circ \] and is a periodic function which repeats itself after \[2\pi \] . This means that after \[2\pi \] it gives us the same value we got at \[0{}^\circ \] and it continues till the next \[2\pi \] part of the curve. The sin curve starts at \[0\] on the y axis and \[0{}^\circ \] on the x axis. It then continues till it reaches \[1\] on y axis when we are at \[90{}^\circ \] or \[\dfrac{\pi }{2}\] (as we can say in radians) on the x axis. After that sin curve starts decreasing again till we reach 0 on y axis while being at \[180{}^\circ \] or \[\pi \] on x axis. The function keeps decreasing until we reach \[-1\] on the y axis at \[\dfrac{3\pi }{2}\] on the x axis. After that the function starts increasing again till reaching \[0\] on y axis when being at \[2\pi \] at x axis. After \[2\pi \] the function is periodic which we can expressed as
\[\sin (\theta )=\sin (\theta +2\pi )\]
The sine function and cosine has the phase difference of \[\dfrac{\pi }{2}\] with each other the cosine function being \[\dfrac{\pi }{2}\] ahead when it comes in comparison to sine function. Both the graphs meet each other at \[\dfrac{\pi }{4}\] and \[\dfrac{5\pi }{4}\] .
Note: This graph of sine is used in technical analysis and when we trade we can use it to identify patterns and crossover when it comes to oscillators. Sine curves are also used to represent the oscillations of particles in physics.
Recently Updated Pages
Master Class 12 Economics: Engaging Questions & Answers for Success
Master Class 12 English: Engaging Questions & Answers for Success
Master Class 12 Social Science: Engaging Questions & Answers for Success
Master Class 12 Maths: Engaging Questions & Answers for Success
Master Class 12 Physics: Engaging Questions & Answers for Success
Master Class 11 Social Science: Engaging Questions & Answers for Success
Trending doubts
One Metric ton is equal to kg A 10000 B 1000 C 100 class 11 physics CBSE
Difference Between Prokaryotic Cells and Eukaryotic Cells
Two of the body parts which do not appear in MRI are class 11 biology CBSE
1 ton equals to A 100 kg B 1000 kg C 10 kg D 10000 class 11 physics CBSE
Draw a diagram of nephron and explain its structur class 11 biology CBSE
10 examples of friction in our daily life