


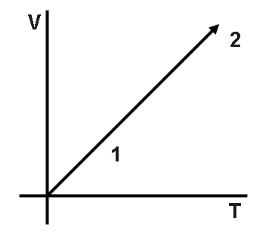
Volume versus temperature graph of two moles of helium gas is as shown in figure. The ratio of heat absorbed and the work done by the gas in process 1−2 is.
A. $3$
B. $\dfrac{5}{2}$
C. $\dfrac{5}{3}$
D. $\dfrac{7}{2}$
Answer
518.1k+ views
Hint:To solve this question, we will directly use the specific heat at a constant pressure of monatomic gas and substitute the same value in the equation of heat absorbed. Then we will simply divide the equation with the equation of the work done in the case of the isobaric process to get the required solution
Formula used:
$\vartriangle U = n{C_v}\vartriangle T$
$\Rightarrow \vartriangle Q = n{C_p}\vartriangle T$
Where, $n$ is the number of moles, ${C_p}$ is the heat at constant pressure, ${C_v}$ is the molar heat capacity and $\vartriangle T$ is the change in temperature.
Complete step by step answer:
Since, $V \propto T$ is a straight line. Therefore, we can say that, $P$ is constant. And here it is given, $n = 2$ and $He$ is a monatomic gas.
As $\vartriangle Q = n{C_p}\vartriangle T$ ,
$\vartriangle U = n{C_v}\vartriangle T$
Also,
$\vartriangle W = \vartriangle Q - \vartriangle U \\
\Rightarrow \vartriangle W = \mu ({C_p} - {C_v})\vartriangle T \\ $
Therefore, required ratio is,
$\dfrac{{\vartriangle Q}}{{\vartriangle W}} = \dfrac{{n{C_p}\vartriangle T}}{{n({C_p} - {C_v})\vartriangle T}} \\
\Rightarrow \dfrac{{\vartriangle Q}}{{\vartriangle W}} = \dfrac{{{C_p}}}{{{C_p} - {C_v}}} \\ $
Further we can write,
\[\dfrac{{\vartriangle Q}}{{\vartriangle W}} = \dfrac{{{C_p}}}{{{C_p} - {C_v}}} \\
\Rightarrow \dfrac{{\vartriangle Q}}{{\vartriangle W}} = \dfrac{1}{{1 - \dfrac{{{C_v}}}{{{C_p}}}}} \\ \]
And we know that for monoatomic gas $\gamma = \dfrac{{{C_p}}}{{{C_v}}} = \dfrac{5}{3}$. Now, substituting the value in above equation,
\[\dfrac{{\vartriangle Q}}{{\vartriangle W}} = \dfrac{1}{{1 - \dfrac{{{C_v}}}{{{C_p}}}}} \\
\Rightarrow \dfrac{{\vartriangle Q}}{{\vartriangle W}} = \dfrac{1}{{1 - \dfrac{3}{5}}} \\
\therefore \dfrac{{\vartriangle Q}}{{\vartriangle W}} = \dfrac{5}{2} \]
Therefore, the ratio of the heat absorbed and the work done by the gas from process 1-2 is: \[\dfrac{5}{2}\] .
Hence, the correct option is B.
Note:Note that, in the graph of volume versus temperature every line describes the isobar, which means the atoms which have the same mass number and different atomic number. The graph also represents Charles’s law. And the graph which is plotted shows constant pressure.
Recently Updated Pages
Master Class 11 Social Science: Engaging Questions & Answers for Success
Master Class 11 English: Engaging Questions & Answers for Success
Master Class 11 Maths: Engaging Questions & Answers for Success
Master Class 11 Chemistry: Engaging Questions & Answers for Success
Master Class 11 Biology: Engaging Questions & Answers for Success
Master Class 11 Physics: Engaging Questions & Answers for Success
Trending doubts
One Metric ton is equal to kg A 10000 B 1000 C 100 class 11 physics CBSE
Difference Between Prokaryotic Cells and Eukaryotic Cells
Draw a diagram of a plant cell and label at least eight class 11 biology CBSE
Two of the body parts which do not appear in MRI are class 11 biology CBSE
Which gas is abundant in air class 11 chemistry CBSE
10 examples of friction in our daily life