


Use the tables below to draw linear graphs.
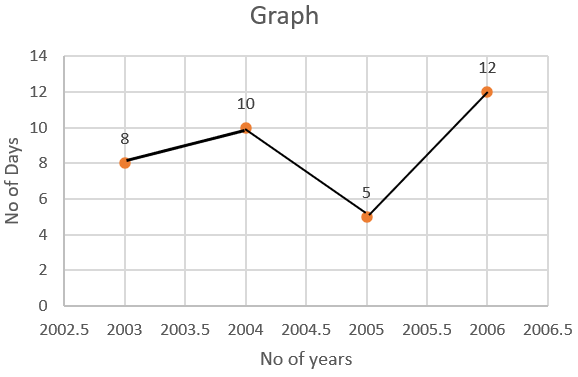
a. The number of days a hill side city received snow in different years.
Year 2003 2004 2005 2006 Days 8 10 5 12
b. Population (in thousands) of men and women in a village in different years.
Year 2003 2004 2005 2006 2007 Men in no 12 12.5 13 13.2 13.5 Women in no 11.3 11.9 13 13.6 12.8
| Year | 2003 | 2004 | 2005 | 2006 |
| Days | 8 | 10 | 5 | 12 |
| Year | 2003 | 2004 | 2005 | 2006 | 2007 |
| Men in no | 12 | 12.5 | 13 | 13.2 | 13.5 |
| Women in no | 11.3 | 11.9 | 13 | 13.6 | 12.8 |
Answer
533.1k+ views
Hint: We need to plot the graphs for the given tables. We start to solve the two questions by identifying the variables of the graph. Then, determine the scale of the graph and plot the points given in the question on the respective axis to get the required result.
Complete step by step solution:
The graph is a diagram that represents variation of a single with respect to other variables. It represents data in an organised manner.
A cartesian plane is a graph with one x-axis and one y-axis. The origin is the center of the graph. The points on the plane are matched with a pair of numbers located on x-axis and y-axis respectively.
In the cartesian plane, the numbers on the right of zero are positive and to the left are negative on the x-axis. The numbers below zero are negative and above are positive on the y-axis.
According to our question, we will need to plot a graph of the first table.
We start to draw a graph by plotting the values of years on x-axis and the values of days on y-axis.
Scale:
On x-axis,
$\Rightarrow$ 1cm = 0.5 units
On y-axis,
$\Rightarrow$ 1 cm = 2 units
Plotting the graph for the table 2,
We draw a graph by plotting the values of years on x-axis and the values of days on y-axis.
Scale:
On x-axis,
$\Rightarrow$ 1cm = 0.5 units
On y-axis,
$\Rightarrow$ 1 cm = 2 units
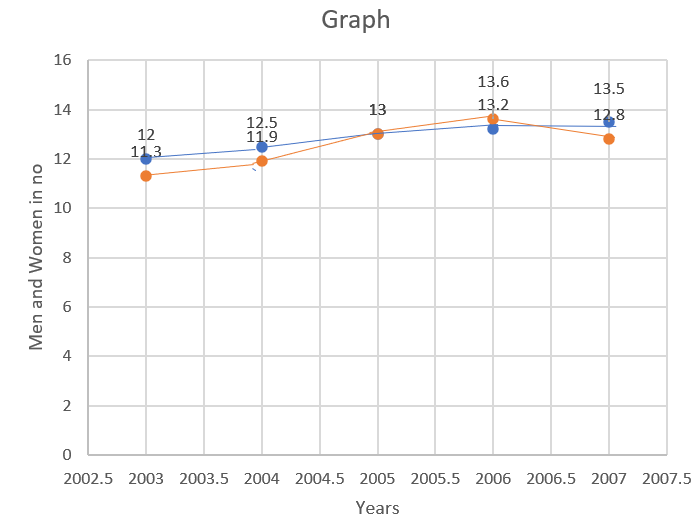
The blue line in the above graph represents the number of women
The orange line in the above graph represents the number of men
The upper data value corresponds to orange line and lower data value corresponds to blue line
Note: To plot a point on a graph,
1. Locate its position on x-axis
2. Locate its position on y-axis.
3. Mark the point where the positions on both axes meet.
We need to plot the points on the graph precisely to demonstrate the relationship between the numerical values on x-axis and y-axis.
Complete step by step solution:
The graph is a diagram that represents variation of a single with respect to other variables. It represents data in an organised manner.
A cartesian plane is a graph with one x-axis and one y-axis. The origin is the center of the graph. The points on the plane are matched with a pair of numbers located on x-axis and y-axis respectively.
In the cartesian plane, the numbers on the right of zero are positive and to the left are negative on the x-axis. The numbers below zero are negative and above are positive on the y-axis.
According to our question, we will need to plot a graph of the first table.
We start to draw a graph by plotting the values of years on x-axis and the values of days on y-axis.
Scale:
On x-axis,
$\Rightarrow$ 1cm = 0.5 units
On y-axis,
$\Rightarrow$ 1 cm = 2 units
Plotting the graph for the table 2,
We draw a graph by plotting the values of years on x-axis and the values of days on y-axis.
Scale:
On x-axis,
$\Rightarrow$ 1cm = 0.5 units
On y-axis,
$\Rightarrow$ 1 cm = 2 units
The blue line in the above graph represents the number of women
The orange line in the above graph represents the number of men
The upper data value corresponds to orange line and lower data value corresponds to blue line
Note: To plot a point on a graph,
1. Locate its position on x-axis
2. Locate its position on y-axis.
3. Mark the point where the positions on both axes meet.
We need to plot the points on the graph precisely to demonstrate the relationship between the numerical values on x-axis and y-axis.
Recently Updated Pages
Master Class 11 Computer Science: Engaging Questions & Answers for Success
Master Class 11 Business Studies: Engaging Questions & Answers for Success
Master Class 11 Economics: Engaging Questions & Answers for Success
Master Class 11 English: Engaging Questions & Answers for Success
Master Class 11 Maths: Engaging Questions & Answers for Success
Master Class 11 Biology: Engaging Questions & Answers for Success
Trending doubts
One Metric ton is equal to kg A 10000 B 1000 C 100 class 11 physics CBSE
There are 720 permutations of the digits 1 2 3 4 5 class 11 maths CBSE
Discuss the various forms of bacteria class 11 biology CBSE
Draw a diagram of a plant cell and label at least eight class 11 biology CBSE
State the laws of reflection of light
Explain zero factorial class 11 maths CBSE