




What is the unit which is used for the area under a velocity-time graph?
Answer
 Verified
561.9k+ views
Hint: The displacement of an object traveling with a constant velocity is equal to the velocity times the amount of time the object is in motion. The area beneath the velocity-time graph is equal to the displacement of the object. The unit in which displacement is measured is meter.
Complete step by step solution:
The displacement is the area under a velocity-time graph. Velocity can be negative if an object is traveling backward. The displacement can be too negative. An area beneath the x-axis has a negative value. An area up the x-axis has a positive value. Be careful when measuring the total displacement; when summing the displacements, get to combine the plus and minus signs of the displacements.
The graph of the v-t graph is shown below:
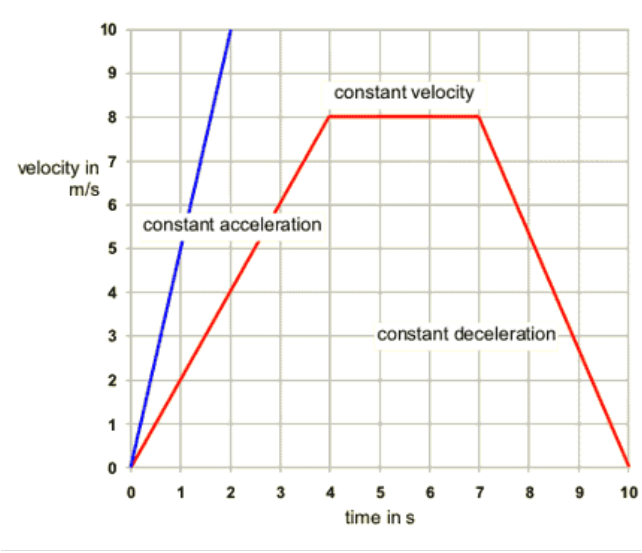
If the graph's appearance can be split into simple geometric frames, the total area beneath the line can be calculated by summing the areas of those shapes.
To determine the displacement when the velocity is not fixed, a velocity-time graph is needed. Usually, velocity is sketched on the vertical axis, and time is sketched on the horizontal axis.
The area below a velocity-time graph is a description of the displacement. If the area is up a time interval, then the displacement during that time interval can be estimated by the area under the graph limited by the time interval. The area beneath a velocity-time graph provides the displacement, and the unit of displacement is the meter.
Note: In a velocity-time graph, acceleration is expressed by the slope, or steepness, of the graph line. Suppose the line slopes upward, velocity increases, so acceleration is positive. If the line is horizontal, velocity is constant, and acceleration is zero. If the line slopes downward, velocity is reducing, and acceleration is negative. Negative acceleration is termed deceleration.
Complete step by step solution:
The displacement is the area under a velocity-time graph. Velocity can be negative if an object is traveling backward. The displacement can be too negative. An area beneath the x-axis has a negative value. An area up the x-axis has a positive value. Be careful when measuring the total displacement; when summing the displacements, get to combine the plus and minus signs of the displacements.
The graph of the v-t graph is shown below:
If the graph's appearance can be split into simple geometric frames, the total area beneath the line can be calculated by summing the areas of those shapes.
To determine the displacement when the velocity is not fixed, a velocity-time graph is needed. Usually, velocity is sketched on the vertical axis, and time is sketched on the horizontal axis.
The area below a velocity-time graph is a description of the displacement. If the area is up a time interval, then the displacement during that time interval can be estimated by the area under the graph limited by the time interval. The area beneath a velocity-time graph provides the displacement, and the unit of displacement is the meter.
Note: In a velocity-time graph, acceleration is expressed by the slope, or steepness, of the graph line. Suppose the line slopes upward, velocity increases, so acceleration is positive. If the line is horizontal, velocity is constant, and acceleration is zero. If the line slopes downward, velocity is reducing, and acceleration is negative. Negative acceleration is termed deceleration.
Recently Updated Pages
Which will be the least stable resonating structure class 11 chemistry CBSE

How many 5 digit telephone numbers can be construc-class-11-maths-CBSE
How do you find the angle of the resultant vector class 11 physics CBSE
Draw labelled diagram of the following i Gram seed class 11 biology CBSE
1 Quintal is equal to a 110 kg b 10 kg c 100kg d 1000 class 11 physics CBSE
What is the need and importance of classification class 11 biology CBSE
Trending doubts
One Metric ton is equal to kg A 10000 B 1000 C 100 class 11 physics CBSE
Find the value of the expression given below sin 30circ class 11 maths CBSE
Draw a diagram of nephron and explain its structur class 11 biology CBSE
10 examples of friction in our daily life
Proton was discovered by A Thomson B Rutherford C Chadwick class 11 chemistry CBSE
The teeth used for biting and cutting food are called class 11 biology CBSE