


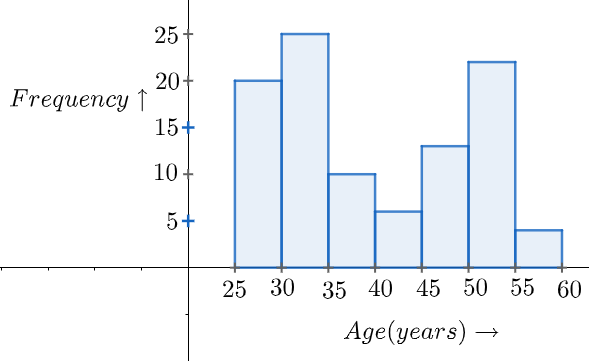
This chart shows the ages of $100$ people in seven age groups.
Find the age group that includes the median age.
Answer
538.8k+ views
Hint: At first, we can draw a table for less than ogive. From this table, we can draw the less than ogive curve. Along the x axis will be the age in less than format and along the y axis will be the frequency of them. For the median, we need to locate the middle position or $\dfrac{100}{2}=50$ . We take a line perpendicular to the y axis at $y=50$ and then find where it intersects the ogive. From this point again, we drop a perpendicular to the x axis. The x value gives the median and then we need to find the age group.
Complete step by step answer:
In this problem, we are given information about the age groups and their frequency of appearing in the group. From this chart, we can draw a table for the less than ogive.
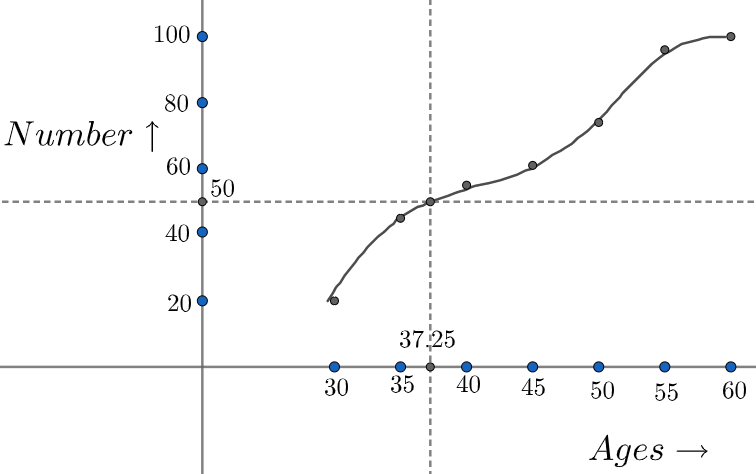
From this table, we can draw the less than ogive curve. Along the x axis will be the age in less than format and along the y axis will be the frequency of them. This ogive is analytical to the people in the group arranged in ascending order. If we pick a person from say the ${{40}^{th}}$ position, then the age of that person can be found out from the ogive. We will take a line perpendicular to the y axis at $y=40$ and then find where it intersects the ogive. From this point again, we drop a perpendicular to the x axis.
So, for the median, we need to locate the middle position or $\dfrac{100}{2}=50$ . We take a line perpendicular to the y axis at $y=50$ and then find where it intersects the ogive. From this point again, we drop a perpendicular to the x axis. Doing this gives the value $x=37.25$ .
Thus, we can conclude that the median is $37.25$ years and this belongs to the age group $35-40$ .
Note: We should be careful in drawing the table. We should take the cumulative frequency instead of copying the ordinate points from the bar graph. Also, we should remember that the ogive is a smooth curve and so, we should not simply join the points using straight lines.
Complete step by step answer:
In this problem, we are given information about the age groups and their frequency of appearing in the group. From this chart, we can draw a table for the less than ogive.
| Age | Less than $30$ | Less than $35$ | Less than $40$ | Less than $45$ | Less than $50$ | Less than $55$ | Less than $60$ |
| Frequency/Number | $20$ | $45$ | $55$ | $61$ | $74$ | $96$ | $100$ |
From this table, we can draw the less than ogive curve. Along the x axis will be the age in less than format and along the y axis will be the frequency of them. This ogive is analytical to the people in the group arranged in ascending order. If we pick a person from say the ${{40}^{th}}$ position, then the age of that person can be found out from the ogive. We will take a line perpendicular to the y axis at $y=40$ and then find where it intersects the ogive. From this point again, we drop a perpendicular to the x axis.
So, for the median, we need to locate the middle position or $\dfrac{100}{2}=50$ . We take a line perpendicular to the y axis at $y=50$ and then find where it intersects the ogive. From this point again, we drop a perpendicular to the x axis. Doing this gives the value $x=37.25$ .
Thus, we can conclude that the median is $37.25$ years and this belongs to the age group $35-40$ .
Note: We should be careful in drawing the table. We should take the cumulative frequency instead of copying the ordinate points from the bar graph. Also, we should remember that the ogive is a smooth curve and so, we should not simply join the points using straight lines.
Recently Updated Pages
Master Class 12 Business Studies: Engaging Questions & Answers for Success
Master Class 12 Biology: Engaging Questions & Answers for Success
Master Class 12 Chemistry: Engaging Questions & Answers for Success
Class 12 Question and Answer - Your Ultimate Solutions Guide
Master Class 11 Social Science: Engaging Questions & Answers for Success
Master Class 11 English: Engaging Questions & Answers for Success
Trending doubts
What is the full form of NDA a National Democratic class 10 social science CBSE
Who Won 36 Oscar Awards? Record Holder Revealed
Bharatiya Janata Party was founded in the year A 1979 class 10 social science CBSE
Why is it 530 pm in india when it is 1200 afternoon class 10 social science CBSE
What is meant by the term constituency A Place where class 10 social science CBSE
The highest temperature in Karnataka is recorded in class 10 social science CBSE