


The values of current I flowing in a given resistor for the corresponding values of potential difference V across the resistor are given below:
I (amperes) $0.5$ $1$ $2$ $3$ $4$ V(Volts) $1.6$ $3.4$ $6.7$ $10.2$ $13.2$
Plot a graph between V and I and calculate the resistance of that resistor.
| I (amperes) | $0.5$ | $1$ | $2$ | $3$ | $4$ |
| V(Volts) | $1.6$ | $3.4$ | $6.7$ | $10.2$ | $13.2$ |
Answer
610.8k+ views
Hint
According to Ohm’s law, a current(I) that flows in a conductor is always proportional to the voltage applied across it (V) and the ratio $\dfrac{V}{I} = R$where R is the constant called Resistance. If the voltage is increased, the current increases, yet Resistance is constant. Thus, the graph plotted will have a constant slope, and the $\tan \theta $will give the value of Resistance.
$\Rightarrow R = \dfrac{V}{I}$Where R is the resistance in conductor, V is the Voltage applied and I is the flowing current.
$\Rightarrow {R_{mean}} = \dfrac{{{R_1} + {R_2} + {R_3} + {R_4} + {R_5}}}{5}$
Equation of a line: $y = mx + c$
Complete step by step answer
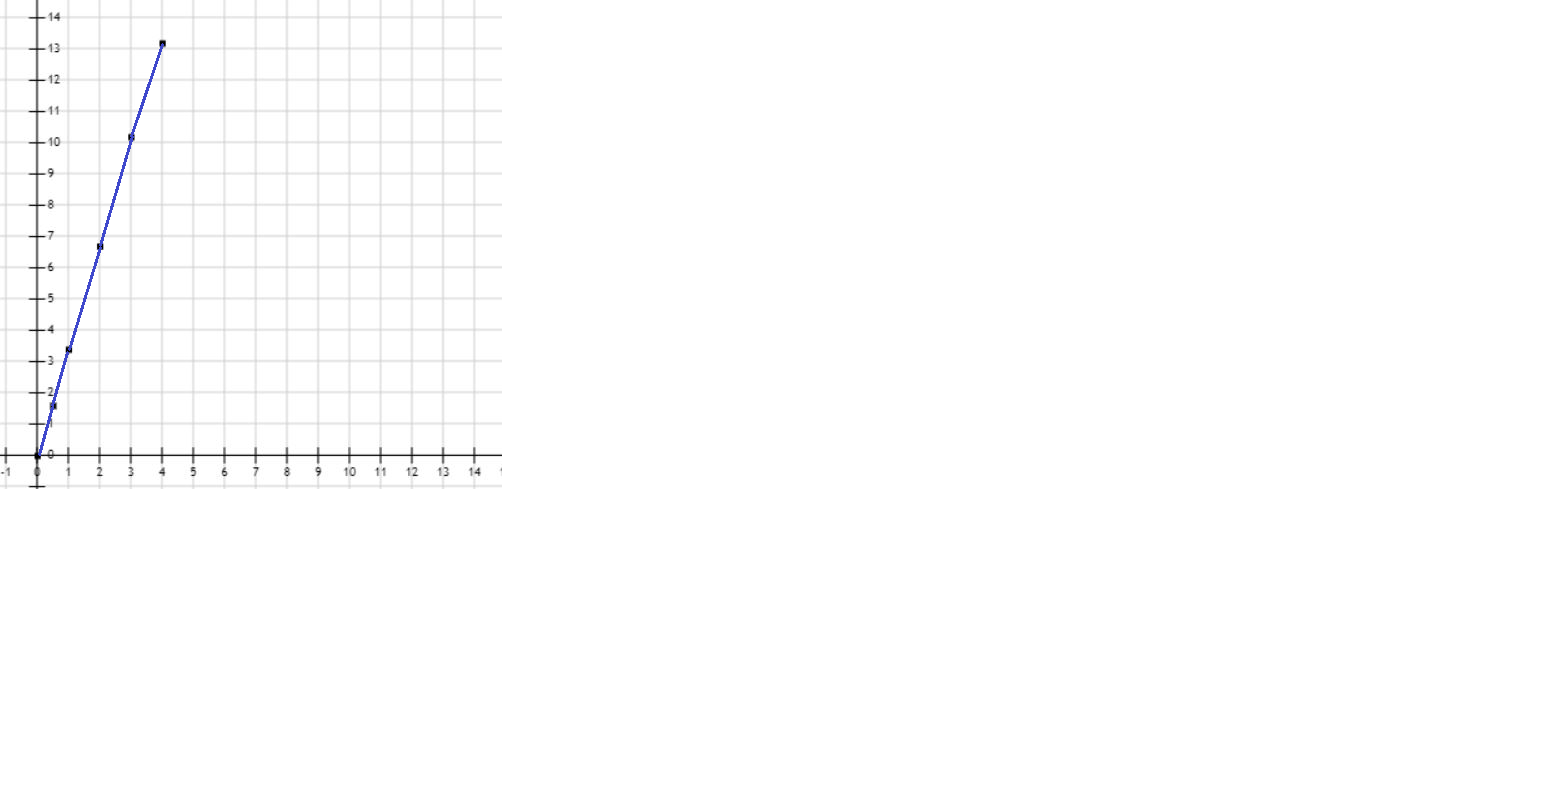
We plot the graph between V and I manually which means that a point is marked in the graph wherever the corresponding values of V and I match, there will be a total of 5 points.
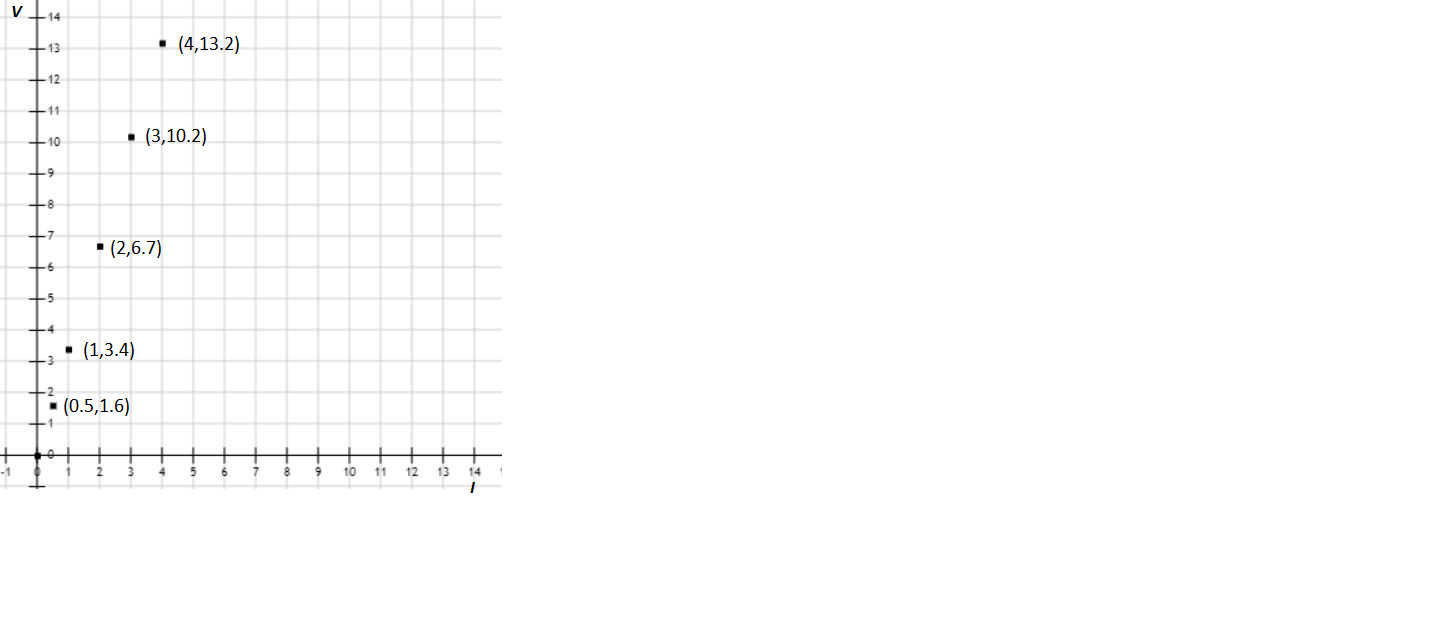
-After this we join all the points, resulting in creation of the graph.
There are 2 methods to solve the resistance, let us see them one by one.
Method 1: We take all 5 values of I and V and calculate 5 values of R
$\Rightarrow {R_1} = \dfrac{V}{I} = \dfrac{{1.6}}{{0.5}} = 3.2\Omega $
$\Rightarrow {R_2} = \dfrac{V}{I} = \dfrac{{3.4}}{1} = 3.2\Omega $
$\Rightarrow {R_3} = \dfrac{V}{I} = \dfrac{{6.7}}{2} = 3.35\Omega $
$\Rightarrow {R_4} = \dfrac{V}{I} = \dfrac{{10.2}}{3} = 3.4\Omega $
$\Rightarrow {R_5} = \dfrac{V}{I} = \dfrac{{13.2}}{4} = 3.3\Omega $
-Now we take the mean of all values of R
$\Rightarrow {R_{mean}} = \dfrac{{3.2 + 3.4 + 3.35 + 3.4 + 3.3}}{5} = \dfrac{{16.85}}{5} = 3.37\Omega $
Thus the Resistance in the conductor is equal to $3.37\Omega $
Method 2: This is a short cut method, it uses the fact that the relation between V and I is linear, which means when plotted, the graph must form a straight line.
Here, you may take any value of I and the corresponding value of V and divide them, but for better accuracy, here we are taking the average values of V and I,
$\Rightarrow {V_{avg}} = \dfrac{{{V_1} + {V_2} + {V_3} + {V_4} + {V_5}}}{5}$
$\Rightarrow {V_{avg}} = \dfrac{{1.6 + 3.4 + 6.7 + 10.2 + 13.2}}{5} = 7.02{\text{V}}$
$\Rightarrow {I_{avg}} = \dfrac{{{I_1} + {I_2} + {I_3} + {I_4} + {I_5}}}{5}$
$\Rightarrow {I_{avg}} = \dfrac{{0.5 + 1 + 2 + 3 + 4}}{5} = 2.1{\text{A}}$
Equation of the line in V-I graph may be compared to,
$\Rightarrow y = mx + c$
$\Rightarrow V = IR + c$
We know that, for V=0, I=0 (When no voltage is applied, no current flows through the conductor)
So,$c = 0$
The equation of line now becomes
$\Rightarrow V = IR$
By putting the values of ${V_{avg}}{\text{ and }}{I_{avg}}$,
$\Rightarrow 7.02 = 2.1 \times R$
$\Rightarrow R = \dfrac{{7.02}}{{2.1}} = 3.34\Omega $.
Note
The accuracy of method 2 may vary according to the accuracy of observation. If the values given in the question are errorless, the answer delivered by method 2 would be the same as in method 1. But in practical, observation has errors (like in this question), therefore the graph will not be a straight line, but will be in the form of zig-zag at a very small scale. So it is better to use Method 1 for the greatest accuracy.
According to Ohm’s law, a current(I) that flows in a conductor is always proportional to the voltage applied across it (V) and the ratio $\dfrac{V}{I} = R$where R is the constant called Resistance. If the voltage is increased, the current increases, yet Resistance is constant. Thus, the graph plotted will have a constant slope, and the $\tan \theta $will give the value of Resistance.
$\Rightarrow R = \dfrac{V}{I}$Where R is the resistance in conductor, V is the Voltage applied and I is the flowing current.
$\Rightarrow {R_{mean}} = \dfrac{{{R_1} + {R_2} + {R_3} + {R_4} + {R_5}}}{5}$
Equation of a line: $y = mx + c$
Complete step by step answer
We plot the graph between V and I manually which means that a point is marked in the graph wherever the corresponding values of V and I match, there will be a total of 5 points.
-After this we join all the points, resulting in creation of the graph.
There are 2 methods to solve the resistance, let us see them one by one.
Method 1: We take all 5 values of I and V and calculate 5 values of R
$\Rightarrow {R_1} = \dfrac{V}{I} = \dfrac{{1.6}}{{0.5}} = 3.2\Omega $
$\Rightarrow {R_2} = \dfrac{V}{I} = \dfrac{{3.4}}{1} = 3.2\Omega $
$\Rightarrow {R_3} = \dfrac{V}{I} = \dfrac{{6.7}}{2} = 3.35\Omega $
$\Rightarrow {R_4} = \dfrac{V}{I} = \dfrac{{10.2}}{3} = 3.4\Omega $
$\Rightarrow {R_5} = \dfrac{V}{I} = \dfrac{{13.2}}{4} = 3.3\Omega $
-Now we take the mean of all values of R
$\Rightarrow {R_{mean}} = \dfrac{{3.2 + 3.4 + 3.35 + 3.4 + 3.3}}{5} = \dfrac{{16.85}}{5} = 3.37\Omega $
Thus the Resistance in the conductor is equal to $3.37\Omega $
Method 2: This is a short cut method, it uses the fact that the relation between V and I is linear, which means when plotted, the graph must form a straight line.
Here, you may take any value of I and the corresponding value of V and divide them, but for better accuracy, here we are taking the average values of V and I,
$\Rightarrow {V_{avg}} = \dfrac{{{V_1} + {V_2} + {V_3} + {V_4} + {V_5}}}{5}$
$\Rightarrow {V_{avg}} = \dfrac{{1.6 + 3.4 + 6.7 + 10.2 + 13.2}}{5} = 7.02{\text{V}}$
$\Rightarrow {I_{avg}} = \dfrac{{{I_1} + {I_2} + {I_3} + {I_4} + {I_5}}}{5}$
$\Rightarrow {I_{avg}} = \dfrac{{0.5 + 1 + 2 + 3 + 4}}{5} = 2.1{\text{A}}$
Equation of the line in V-I graph may be compared to,
$\Rightarrow y = mx + c$
$\Rightarrow V = IR + c$
We know that, for V=0, I=0 (When no voltage is applied, no current flows through the conductor)
So,$c = 0$
The equation of line now becomes
$\Rightarrow V = IR$
By putting the values of ${V_{avg}}{\text{ and }}{I_{avg}}$,
$\Rightarrow 7.02 = 2.1 \times R$
$\Rightarrow R = \dfrac{{7.02}}{{2.1}} = 3.34\Omega $.
Note
The accuracy of method 2 may vary according to the accuracy of observation. If the values given in the question are errorless, the answer delivered by method 2 would be the same as in method 1. But in practical, observation has errors (like in this question), therefore the graph will not be a straight line, but will be in the form of zig-zag at a very small scale. So it is better to use Method 1 for the greatest accuracy.
Recently Updated Pages
Master Class 12 Economics: Engaging Questions & Answers for Success
Master Class 12 English: Engaging Questions & Answers for Success
Master Class 12 Social Science: Engaging Questions & Answers for Success
Master Class 12 Maths: Engaging Questions & Answers for Success
Master Class 12 Physics: Engaging Questions & Answers for Success
Master Class 9 General Knowledge: Engaging Questions & Answers for Success
Trending doubts
Which are the Top 10 Largest Countries of the World?
Draw a labelled sketch of the human eye class 12 physics CBSE
Differentiate between homogeneous and heterogeneous class 12 chemistry CBSE
Sulphuric acid is known as the king of acids State class 12 chemistry CBSE
Why is the cell called the structural and functional class 12 biology CBSE
Draw ray diagrams each showing i myopic eye and ii class 12 physics CBSE