


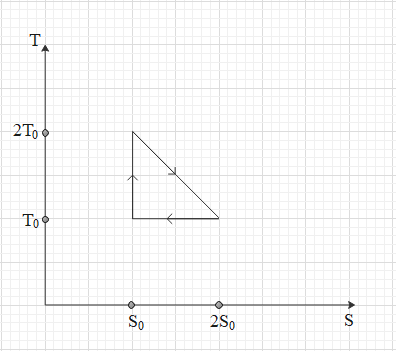
The temperature – entropy graph diagram of a reversible engine cycle is given in the figure. Its efficiency is,
(A) \[\dfrac{1}{4}\]
(B) \[\dfrac{1}{2}\]
(C) \[\dfrac{2}{3}\]
(D) \[\dfrac{1}{3}\]
Answer
624.9k+ views
Hint: The area under the \[T\to S\] gives the change in internal energy of the systems. Efficiency of the engine is given by total work over heat absorbed by the engine. So, in the diagram work done in all three parts equal to the energy given to it or given by it, is the area under that curve with X-axis.
Formula used:
\[\eta =\dfrac{{{Q}_{1}}-{{Q}_{2}}}{{{Q}_{1}}}\]
Complete answer:
The area under the curve in the curve \[T\to S\] gives the heat or can say one of the forms of work.
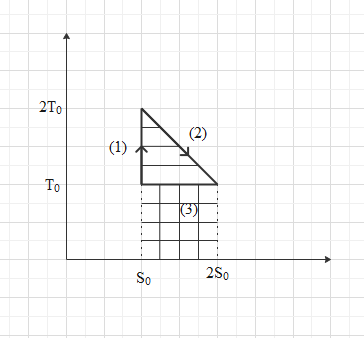
Here all three processes denoted by different three parts.
For part \[(1)\],
\[{{Q}_{0}}=0\], Because the temperature in this process is constant and therefore no change in its heat.
For part \[(2)\],
The horizontal lines represent the area under this curve. Heat change in second process,
\[{{Q}_{1}}=\dfrac{1}{2}(2{{S}_{0}}-{{S}_{0}})(2{{T}_{0}}-{{T}_{0}})+(2{{S}_{0}}-{{S}_{0}})({{T}_{0}}-0)\]
\[\therefore {{Q}_{1}}=\dfrac{1}{2}({{S}_{0}})({{T}_{0}})+({{S}_{0}})({{T}_{0}})\]
\[\therefore {{Q}_{1}}=\dfrac{3}{2}({{S}_{0}})({{T}_{0}})\]
For part \[(3)\],
The vertical lines represent the area under this curve. Heat change in second process,
\[{{Q}_{2}}=(2{{S}_{0}}-{{S}_{0}})({{T}_{0}}-0)\]
\[\therefore {{Q}_{2}}=({{S}_{0}})({{T}_{0}})\]
Now the efficiency of the engine is given by,
\[\eta =\dfrac{{{Q}_{1}}-{{Q}_{2}}}{{{Q}_{1}}}\]
\[\therefore\eta=\dfrac{\dfrac{3}{2}({{S}_{0}})({{T}_{0}})-({{S}_{0}})({{T}_{0}})}{\dfrac{3}{2}({{S}_{0}})({{T}_{0}})}\]
\[\therefore \eta =\dfrac{1}{3}\]
So, the correct answer is “Option D”.
Additional Information:
Entropy (\[\Delta S\]): Entropy is the measurement of the thermal energy per unit temperature. Generally it is the randomness of the system.
Note:
As in \[P\to V\] area under the curve gives the work done, here also the area under \[T\to S\] gives heat change in the system. It can be understood by the equation \[\Delta Q=T\Delta S\]. Here \[\Delta S\] is a change in entropy. If the temperature is constant in any process then in that process heat change (\[\Delta Q\]) is zero because it is the path independent function.
Formula used:
\[\eta =\dfrac{{{Q}_{1}}-{{Q}_{2}}}{{{Q}_{1}}}\]
Complete answer:
The area under the curve in the curve \[T\to S\] gives the heat or can say one of the forms of work.
Here all three processes denoted by different three parts.
For part \[(1)\],
\[{{Q}_{0}}=0\], Because the temperature in this process is constant and therefore no change in its heat.
For part \[(2)\],
The horizontal lines represent the area under this curve. Heat change in second process,
\[{{Q}_{1}}=\dfrac{1}{2}(2{{S}_{0}}-{{S}_{0}})(2{{T}_{0}}-{{T}_{0}})+(2{{S}_{0}}-{{S}_{0}})({{T}_{0}}-0)\]
\[\therefore {{Q}_{1}}=\dfrac{1}{2}({{S}_{0}})({{T}_{0}})+({{S}_{0}})({{T}_{0}})\]
\[\therefore {{Q}_{1}}=\dfrac{3}{2}({{S}_{0}})({{T}_{0}})\]
For part \[(3)\],
The vertical lines represent the area under this curve. Heat change in second process,
\[{{Q}_{2}}=(2{{S}_{0}}-{{S}_{0}})({{T}_{0}}-0)\]
\[\therefore {{Q}_{2}}=({{S}_{0}})({{T}_{0}})\]
Now the efficiency of the engine is given by,
\[\eta =\dfrac{{{Q}_{1}}-{{Q}_{2}}}{{{Q}_{1}}}\]
\[\therefore\eta=\dfrac{\dfrac{3}{2}({{S}_{0}})({{T}_{0}})-({{S}_{0}})({{T}_{0}})}{\dfrac{3}{2}({{S}_{0}})({{T}_{0}})}\]
\[\therefore \eta =\dfrac{1}{3}\]
So, the correct answer is “Option D”.
Additional Information:
Entropy (\[\Delta S\]): Entropy is the measurement of the thermal energy per unit temperature. Generally it is the randomness of the system.
Note:
As in \[P\to V\] area under the curve gives the work done, here also the area under \[T\to S\] gives heat change in the system. It can be understood by the equation \[\Delta Q=T\Delta S\]. Here \[\Delta S\] is a change in entropy. If the temperature is constant in any process then in that process heat change (\[\Delta Q\]) is zero because it is the path independent function.
Recently Updated Pages
Master Class 11 Social Science: Engaging Questions & Answers for Success
Master Class 11 English: Engaging Questions & Answers for Success
Master Class 11 Maths: Engaging Questions & Answers for Success
Master Class 11 Chemistry: Engaging Questions & Answers for Success
Master Class 11 Biology: Engaging Questions & Answers for Success
Class 11 Question and Answer - Your Ultimate Solutions Guide
Trending doubts
One Metric ton is equal to kg A 10000 B 1000 C 100 class 11 physics CBSE
Difference Between Prokaryotic Cells and Eukaryotic Cells
Find the value of the expression given below sin 30circ class 11 maths CBSE
1 ton equals to A 100 kg B 1000 kg C 10 kg D 10000 class 11 physics CBSE
Two of the body parts which do not appear in MRI are class 11 biology CBSE
Draw a diagram of nephron and explain its structur class 11 biology CBSE