


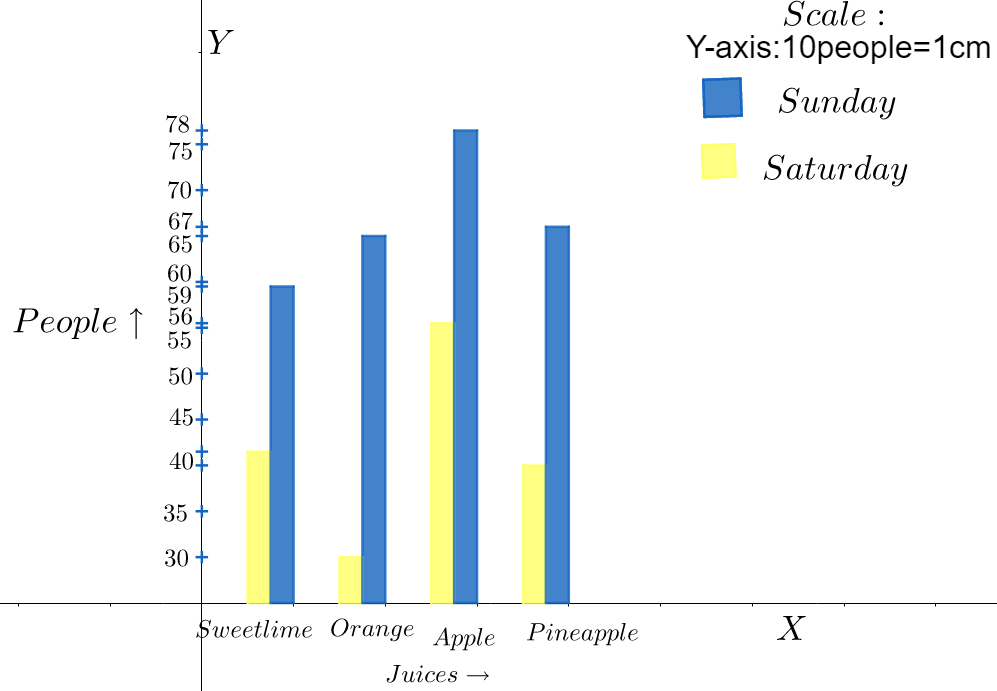
The table below shows the number of people who had the different juices at a juice bar on a Saturday and Sunday. Draw a joint bar graph for this data.
Day Sweet lime Orange Apple Pineapple Saturday \[43\] \[30\] \[56\] \[40\] Sunday \[59\] \[65\] \[78\] \[67\]
| Day | Sweet lime | Orange | Apple | Pineapple |
| Saturday | \[43\] | \[30\] | \[56\] | \[40\] |
| Sunday | \[59\] | \[65\] | \[78\] | \[67\] |
Answer
516.9k+ views
Hint: For the plotting of a joint graph, we take the number of people along the y-axis and the types of juices along the x-axis. We join the data for Saturday and Sunday together along the x-axis. After that, we plot the bar graph accordingly.
Complete step by step answer:
In mathematics, and more specifically in graph theory, a graph is a structure amounting to a set of objects in which some pairs of the objects are in some sense "related". The objects correspond to mathematical abstractions called vertices (also called nodes or points) and each of the related pairs of vertices is called an edge (also called link or line). Typically, a graph is depicted in diagrammatic form as a set of dots or circles for the vertices, joined by lines or curves for the edges. Graphs are one of the objects of study in discrete mathematics.
A bar chart or bar graph is a chart or graph that presents categorical data with rectangular bars with heights or lengths proportional to the values that they represent. The x-axis of the bar graph gives the object and the y-axis represents the quantity of the objects. Each bar corresponds to an object and its height denotes its quantity. A joint bar graph is a set of bar graphs showing different sets of information but joined to each other. Clubbing together Saturday and Sunday, taking the juices on the x-axis and the number of people on the y-axis, we get the graph as,
Note: The thing that confuses us the most in the plotting of a joint graph is which data set should we join or club. Generally, the data which vary the least must be clubbed for convenience. For example, here the data set for the days has only two values, Saturday and Sunday. So, we need to club them.

Recently Updated Pages
Master Class 9 General Knowledge: Engaging Questions & Answers for Success
Master Class 9 Social Science: Engaging Questions & Answers for Success
Master Class 9 English: Engaging Questions & Answers for Success
Master Class 9 Maths: Engaging Questions & Answers for Success
Master Class 9 Science: Engaging Questions & Answers for Success
Class 9 Question and Answer - Your Ultimate Solutions Guide
Trending doubts
Difference Between Plant Cell and Animal Cell
Fill the blanks with the suitable prepositions 1 The class 9 english CBSE
Who is eligible for RTE class 9 social science CBSE
Which places in India experience sunrise first and class 9 social science CBSE
What is pollution? How many types of pollution? Define it
Name 10 Living and Non living things class 9 biology CBSE