


The students of class VIII have to choose among Yoga, Music, Art, Karate, and Dance as an activity. The given table shows the choice made by the girls and boys of class VIII.
Activity Yoga Art Music Karate Dance Girls 15 35 20 25 30 Boys 15 20 15 40 20
Which activity is most preferred by boys and by girls?
| Activity | Yoga | Art | Music | Karate | Dance |
| Girls | 15 | 35 | 20 | 25 | 30 |
| Boys | 15 | 20 | 15 | 40 | 20 |
Answer
599.4k+ views
Hint: We are required to find that out of the given activities, which is most liked by the girls and the boys. To solve this question, we need to use the concept of bar graphs. We will prepare a bar graph separately for girls and boys taking a suitable scale. Then based on those graphs we will find which activity is most preferable.
Complete step-by-step answer:
Let us prepare the bar graph for the girls first.
We will plot the number of girls on the \[y\]-axis, and the various kinds of activities taken up by them on the \[x\]-axis.
Since our data is a factor of 5, we will take the scale as \[1{\rm{ unit}} = 5{\rm{ girls}}\]. This means that 1 unit on the \[y\]-axis will represent 5 girls.
We will then represent our data on the bar graph. On doing so we will obtain the following bar graph,
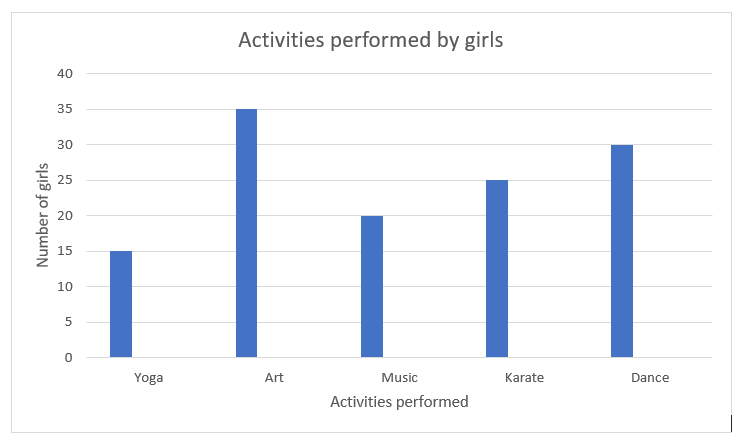
Now based on our above graph we can see that the bar that belongs to Art has the maximum height as compared to the other bars. This means that Art activity is performed by the greatest number of girls.
We will now prepare the bar graph for the boys.
We will plot the number of boys on the \[y\]-axis, and the various kinds of activities taken up by them on the \[x\]-axis.
Since our data is as a factor of 5, we will take the scale as \[1{\rm{ unit}} = 5{\rm{ boys}}\]. This means that 1 unit on the \[y\]-axis will represent 5 boys.
We will then represent our data on the bar graph. On doing so we will obtain the following bar graph,
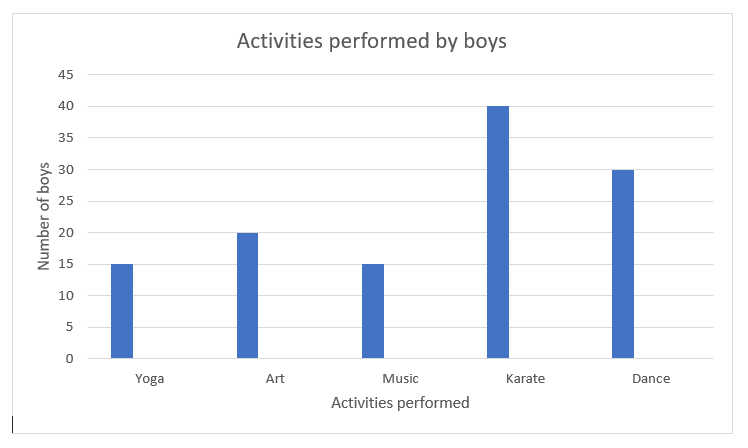
Now based on our above graph we can see that the bar that belongs to Karate has the maximum height as compared to the other bars. This means that Karate activity is performed by the greatest number of boys.
Thus, based on the above bars we can conclude that Art as an activity is most preferred by girls, and Karate as an activity is most preferred by boys.
Note: The alternate method to solve this question can be as follows –
We can solve this question by drawing a double bar graph also. A double bar graph would save our time and energy to make two separate graphs.
We will plot the number of students on the \[y\]-axis, and the various kinds of activities taken up by them on the \[x\]-axis.
Since our data is as a factor of 5, we will take the scale as \[1{\rm{ unit}} = 5{\rm{ students}}\]. This means that 1 unit on the \[y\]-axis will represent 5 students.
We will then represent our data on the bar graph. We will use different colors for both bars to avoid confusion. On doing so we will obtain the following bar graph,
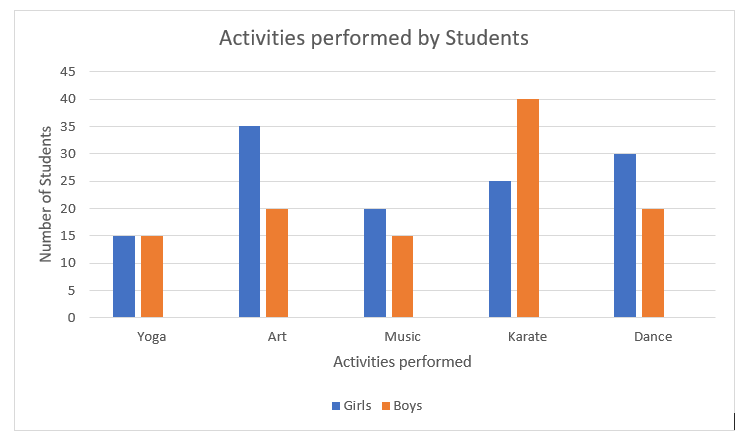
Now from the above graph, we can see that the Blue color represents girls. We can see that the blue bar belonging to the Art has the maximum height as compared to the other bars. This means that Art activity is performed by the greatest number of girls.
We can also see that the Orange color represents boys. We can see that the orange bar belonging to the Karate has the maximum height as compared to the other bars. This means that Karate activity is performed by the greatest number of boys.
Hence, we can conclude that Art as an activity is most preferred by girls, and Karate as an activity is most preferred
Complete step-by-step answer:
Let us prepare the bar graph for the girls first.
We will plot the number of girls on the \[y\]-axis, and the various kinds of activities taken up by them on the \[x\]-axis.
Since our data is a factor of 5, we will take the scale as \[1{\rm{ unit}} = 5{\rm{ girls}}\]. This means that 1 unit on the \[y\]-axis will represent 5 girls.
We will then represent our data on the bar graph. On doing so we will obtain the following bar graph,
Now based on our above graph we can see that the bar that belongs to Art has the maximum height as compared to the other bars. This means that Art activity is performed by the greatest number of girls.
We will now prepare the bar graph for the boys.
We will plot the number of boys on the \[y\]-axis, and the various kinds of activities taken up by them on the \[x\]-axis.
Since our data is as a factor of 5, we will take the scale as \[1{\rm{ unit}} = 5{\rm{ boys}}\]. This means that 1 unit on the \[y\]-axis will represent 5 boys.
We will then represent our data on the bar graph. On doing so we will obtain the following bar graph,
Now based on our above graph we can see that the bar that belongs to Karate has the maximum height as compared to the other bars. This means that Karate activity is performed by the greatest number of boys.
Thus, based on the above bars we can conclude that Art as an activity is most preferred by girls, and Karate as an activity is most preferred by boys.
Note: The alternate method to solve this question can be as follows –
We can solve this question by drawing a double bar graph also. A double bar graph would save our time and energy to make two separate graphs.
We will plot the number of students on the \[y\]-axis, and the various kinds of activities taken up by them on the \[x\]-axis.
Since our data is as a factor of 5, we will take the scale as \[1{\rm{ unit}} = 5{\rm{ students}}\]. This means that 1 unit on the \[y\]-axis will represent 5 students.
We will then represent our data on the bar graph. We will use different colors for both bars to avoid confusion. On doing so we will obtain the following bar graph,
Now from the above graph, we can see that the Blue color represents girls. We can see that the blue bar belonging to the Art has the maximum height as compared to the other bars. This means that Art activity is performed by the greatest number of girls.
We can also see that the Orange color represents boys. We can see that the orange bar belonging to the Karate has the maximum height as compared to the other bars. This means that Karate activity is performed by the greatest number of boys.
Hence, we can conclude that Art as an activity is most preferred by girls, and Karate as an activity is most preferred
Recently Updated Pages
Three beakers labelled as A B and C each containing 25 mL of water were taken A small amount of NaOH anhydrous CuSO4 and NaCl were added to the beakers A B and C respectively It was observed that there was an increase in the temperature of the solutions contained in beakers A and B whereas in case of beaker C the temperature of the solution falls Which one of the following statements isarecorrect i In beakers A and B exothermic process has occurred ii In beakers A and B endothermic process has occurred iii In beaker C exothermic process has occurred iv In beaker C endothermic process has occurred
Master Class 10 Social Science: Engaging Questions & Answers for Success
Master Class 10 Science: Engaging Questions & Answers for Success
Master Class 10 Maths: Engaging Questions & Answers for Success
Master Class 10 General Knowledge: Engaging Questions & Answers for Success
Master Class 10 Computer Science: Engaging Questions & Answers for Success
Three beakers labelled as A B and C each containing 25 mL of water were taken A small amount of NaOH anhydrous CuSO4 and NaCl were added to the beakers A B and C respectively It was observed that there was an increase in the temperature of the solutions contained in beakers A and B whereas in case of beaker C the temperature of the solution falls Which one of the following statements isarecorrect i In beakers A and B exothermic process has occurred ii In beakers A and B endothermic process has occurred iii In beaker C exothermic process has occurred iv In beaker C endothermic process has occurred
Master Class 10 Social Science: Engaging Questions & Answers for Success
Master Class 10 Science: Engaging Questions & Answers for Success
Trending doubts
Explain the Treaty of Vienna of 1815 class 10 social science CBSE
In cricket, what is the term for a bowler taking five wickets in an innings?
Who Won 36 Oscar Awards? Record Holder Revealed
What is the median of the first 10 natural numbers class 10 maths CBSE
Why is it 530 pm in india when it is 1200 afternoon class 10 social science CBSE
What is deficiency disease class 10 biology CBSE