


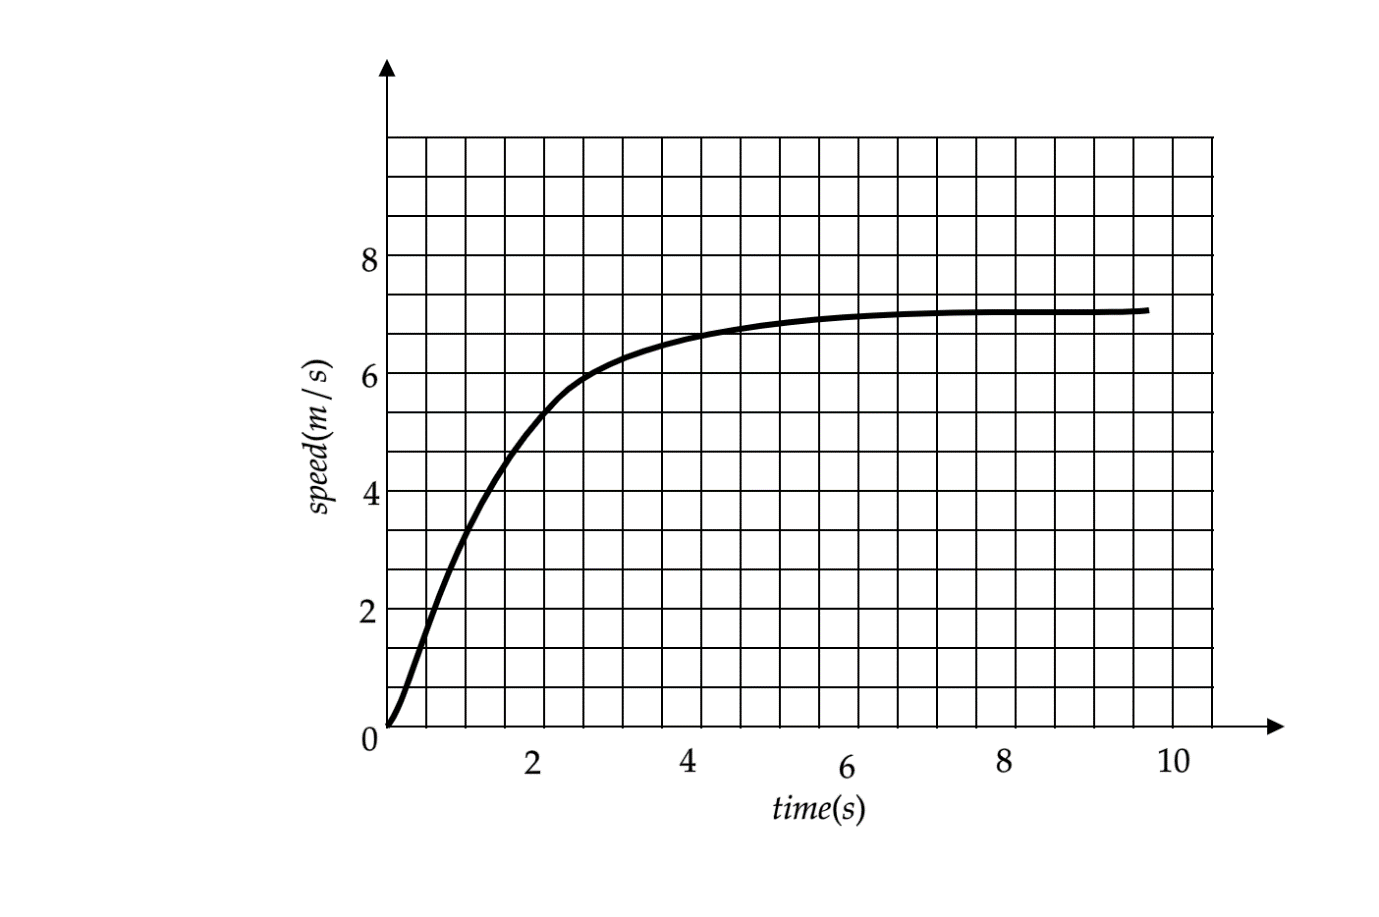
The speed-time graph for a car is shown in the figure.
(a) Find how far the car travels in the first $ 4\text{ seconds} $ . Shade the area on the graph that represents the distance travelled by car during the period.
(b) Which part of the graph represents the uniform motion of the car?
Answer
580.8k+ views
Hint
The area of a graph represents the product of the quantities given on the axes. Here, we have been given the speed of the car along the y-axis and the time for which the car travels is shown along the x-axis. The curve of the graph starts at the origin and rises steeply with a constant slope until it curves around and becomes almost parallel to the x-axis. Let’s see a detailed analysis.
Complete step by step answer
As discussed, the area of the graph would give us the distance travelled (since the distance travelled is a product of the speed and time) and the speed and time are represented on the axes.
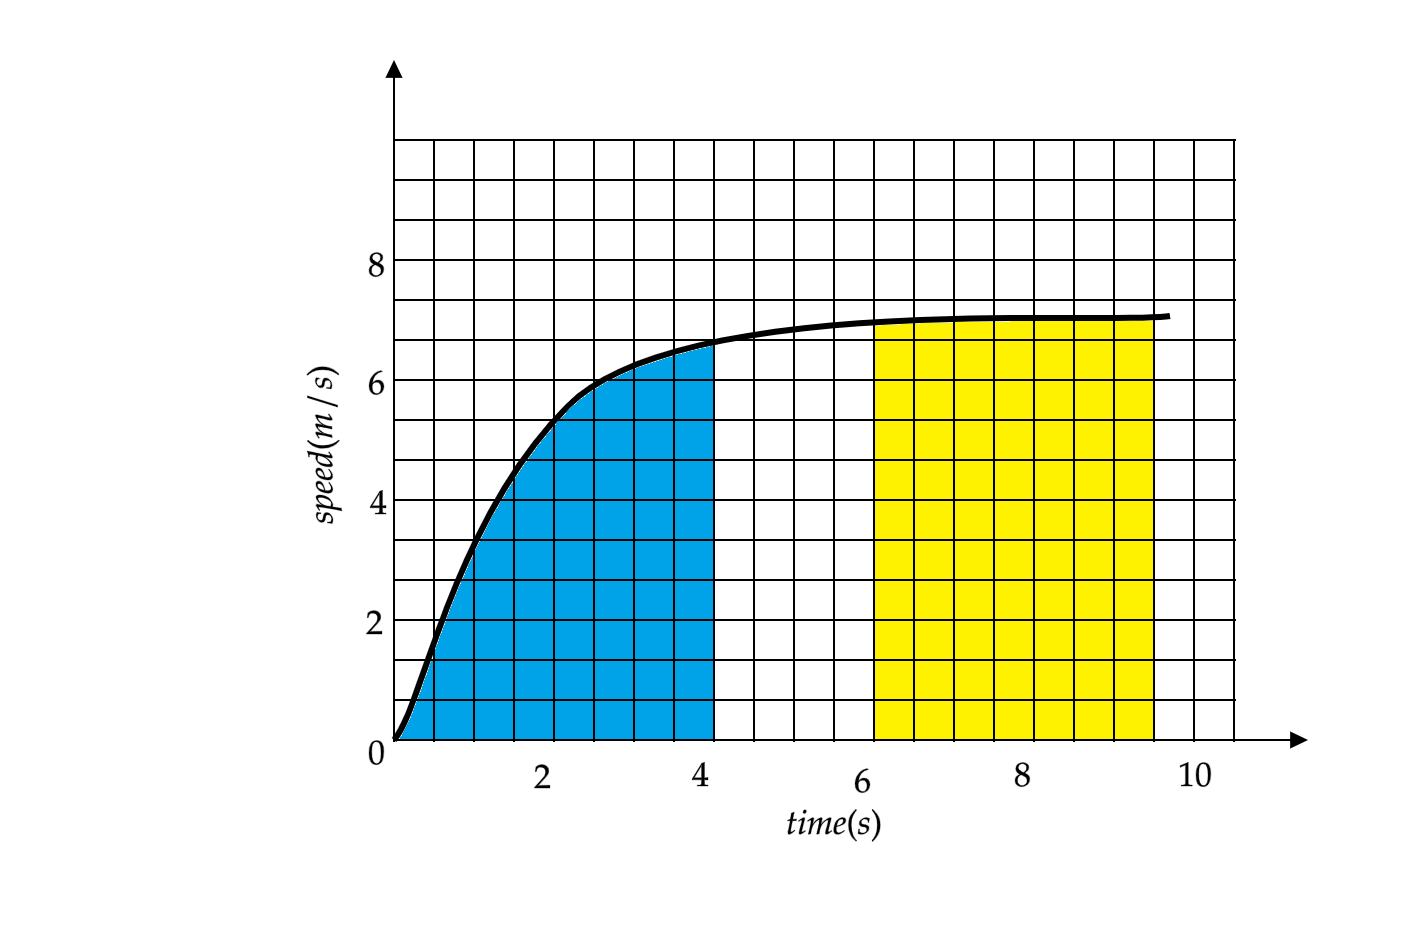
(a) The area of the curve is given by the region between the curve and the x-axis. For the first $ 4\text{ seconds} $ , the region of the graph shaded in blue gives us the distance travelled by car.
(b) Now we have been asked the region of uniform motion of the car; uniform motion is analogous to a uniform velocity. So if we find the region of the graph that shows the car moving with a uniform speed or velocity, we can mark that region as a region of uniform motion. Following this analogy, we can say that the region of the graph from $ 6 $ to $ 10{\text{ seconds}} $ having a constant speed which is shaded in yellow will represent the car in uniform motion.
Note
The slope of the curve of the graph in the first $ \text{3 seconds} $ is constant and represents an accelerated motion. The value of the slope will give the magnitude of the acceleration of the car. The unshaded portion of the graph represents the transition between the motions of the car changing from an accelerated motion to uniform motion.
The area of a graph represents the product of the quantities given on the axes. Here, we have been given the speed of the car along the y-axis and the time for which the car travels is shown along the x-axis. The curve of the graph starts at the origin and rises steeply with a constant slope until it curves around and becomes almost parallel to the x-axis. Let’s see a detailed analysis.
Complete step by step answer
As discussed, the area of the graph would give us the distance travelled (since the distance travelled is a product of the speed and time) and the speed and time are represented on the axes.
(a) The area of the curve is given by the region between the curve and the x-axis. For the first $ 4\text{ seconds} $ , the region of the graph shaded in blue gives us the distance travelled by car.
(b) Now we have been asked the region of uniform motion of the car; uniform motion is analogous to a uniform velocity. So if we find the region of the graph that shows the car moving with a uniform speed or velocity, we can mark that region as a region of uniform motion. Following this analogy, we can say that the region of the graph from $ 6 $ to $ 10{\text{ seconds}} $ having a constant speed which is shaded in yellow will represent the car in uniform motion.
Note
The slope of the curve of the graph in the first $ \text{3 seconds} $ is constant and represents an accelerated motion. The value of the slope will give the magnitude of the acceleration of the car. The unshaded portion of the graph represents the transition between the motions of the car changing from an accelerated motion to uniform motion.
Recently Updated Pages
Master Class 11 Computer Science: Engaging Questions & Answers for Success
Master Class 11 Business Studies: Engaging Questions & Answers for Success
Master Class 11 Economics: Engaging Questions & Answers for Success
Master Class 11 English: Engaging Questions & Answers for Success
Master Class 11 Maths: Engaging Questions & Answers for Success
Master Class 11 Biology: Engaging Questions & Answers for Success
Trending doubts
One Metric ton is equal to kg A 10000 B 1000 C 100 class 11 physics CBSE
There are 720 permutations of the digits 1 2 3 4 5 class 11 maths CBSE
Discuss the various forms of bacteria class 11 biology CBSE
Draw a diagram of a plant cell and label at least eight class 11 biology CBSE
State the laws of reflection of light
Explain zero factorial class 11 maths CBSE