


The runs scored by two teams A and B on the first 60 balls in a cricket match are given below. Represent the data of both the teams on the same graph by frequency polygons.
Number of balls Team A Team B $1 - 6$ 2 5 \[7 - 12\] 1 6 \[13 - 18\] 8 2 \[19 - 24\] 9 10 \[25 - 30\] 4 5 \[31 - 36\] 5 6 \[37 - 42\] 6 3 \[43 - 48\] 10 4 \[49 - 54\] 6 8 \[55 - 60\] 2 10
| Number of balls | Team A | Team B |
| $1 - 6$ | 2 | 5 |
| \[7 - 12\] | 1 | 6 |
| \[13 - 18\] | 8 | 2 |
| \[19 - 24\] | 9 | 10 |
| \[25 - 30\] | 4 | 5 |
| \[31 - 36\] | 5 | 6 |
| \[37 - 42\] | 6 | 3 |
| \[43 - 48\] | 10 | 4 |
| \[49 - 54\] | 6 | 8 |
| \[55 - 60\] | 2 | 10 |
Answer
612k+ views
Hint: In this question, Firstly we have to make the continuous class interval. Class interval refers to the numerical width of any class in a particular distribution. It is defined as the difference between the upper-class limit and the lower class limit.
Complete step-by-step answer:
Step1: It can be observed that the class intervals of the given data are not continuous. There is a gap of one in between them. Therefore,\[\;\dfrac{1}{2} = {\text{ }}0.5\] has to be added to the upper class limit and 0.5 has to be subtracted from the lower class limit.
Also, class mark of each interval can be found by using following formula
\[Class{\text{ }}mark{\text{ }} = \dfrac{{\left( {upper{\text{ }}class{\text{ }}limit + lower{\text{ }}class{\text{ }}limit} \right)}}{2}\]
Step2: Continuous data with class mark of each class interval can be represented as follows
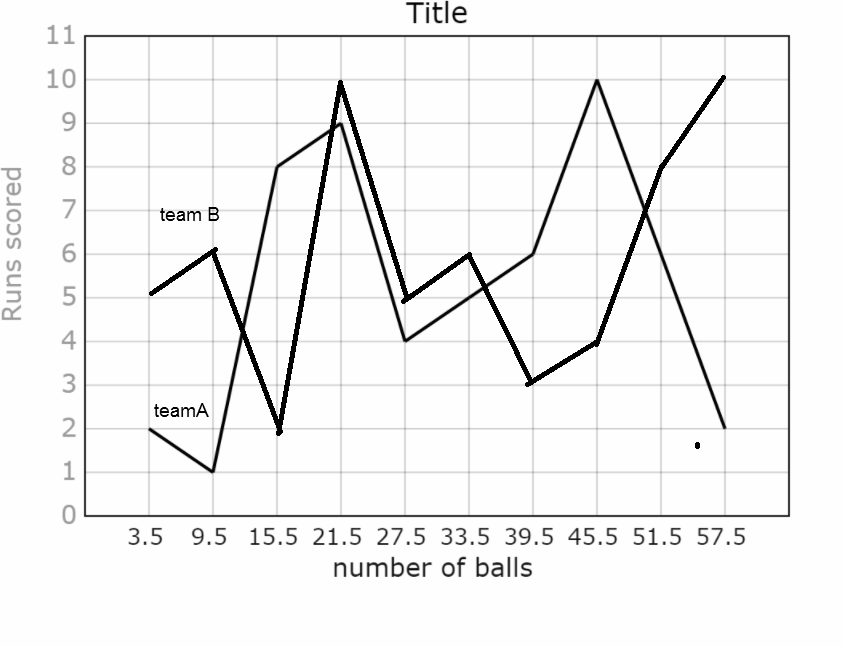
Step3: by taking class marks on x axis and runs scored on y axis a frequency polygons can be constructed as
Note: Remember, In order to make class intervals continuous, you are supposed to subtract 0.5 from the lower limit and add 0.5 in the upper limit. The size of the class interval is often selected as 5, 10, 15 or 20 etc. Each class interval starts at a value that is a multiple of the size. There is yet another visual way of representing quantitative data and its frequencies is a polygon.
Complete step-by-step answer:
Step1: It can be observed that the class intervals of the given data are not continuous. There is a gap of one in between them. Therefore,\[\;\dfrac{1}{2} = {\text{ }}0.5\] has to be added to the upper class limit and 0.5 has to be subtracted from the lower class limit.
Also, class mark of each interval can be found by using following formula
\[Class{\text{ }}mark{\text{ }} = \dfrac{{\left( {upper{\text{ }}class{\text{ }}limit + lower{\text{ }}class{\text{ }}limit} \right)}}{2}\]
Step2: Continuous data with class mark of each class interval can be represented as follows
| Number of Balls | Class mark | Team A | Team B |
| \[0.5 - 6.5\] | 3.5 | 2 | 5 |
| \[6.5 - 12.5\] | 9.5 | 1 | 6 |
| \[12.5 - 18.5\] | 15.5 | 8 | 2 |
| \[24.5 - 30.5\] | 27.5 | 4 | 5 |
| \[30.5 - 36.5\] | 33.5 | 5 | 6 |
| \[36.5 - 42.5\] | 39.5 | 6 | 3 |
| \[42.5 - 48.5\] | 45.5 | 10 | 4 |
| \[48.5 - 54.5\] | 51.5 | 6 | 8 |
| \[54.5 - 60.5\] | 57.5 | 2 | 10 |
Step3: by taking class marks on x axis and runs scored on y axis a frequency polygons can be constructed as
Note: Remember, In order to make class intervals continuous, you are supposed to subtract 0.5 from the lower limit and add 0.5 in the upper limit. The size of the class interval is often selected as 5, 10, 15 or 20 etc. Each class interval starts at a value that is a multiple of the size. There is yet another visual way of representing quantitative data and its frequencies is a polygon.
Recently Updated Pages
Master Class 11 English: Engaging Questions & Answers for Success
Master Class 11 Social Science: Engaging Questions & Answers for Success
Master Class 11 Maths: Engaging Questions & Answers for Success
Master Class 11 Biology: Engaging Questions & Answers for Success
Master Class 11 Physics: Engaging Questions & Answers for Success
Master Class 11 Chemistry: Engaging Questions & Answers for Success
Trending doubts
Explain the Treaty of Vienna of 1815 class 10 social science CBSE
What is the Total Duration of Football Match?
First Cotton Mill of India
In which year voting age was reduced from 21 to 18?
10 examples of evaporation in daily life with explanations
What planets have no moons Which one has only one moon class 10 physics CBSE